Visualisation without limits

Display all your data together, without waiting! 

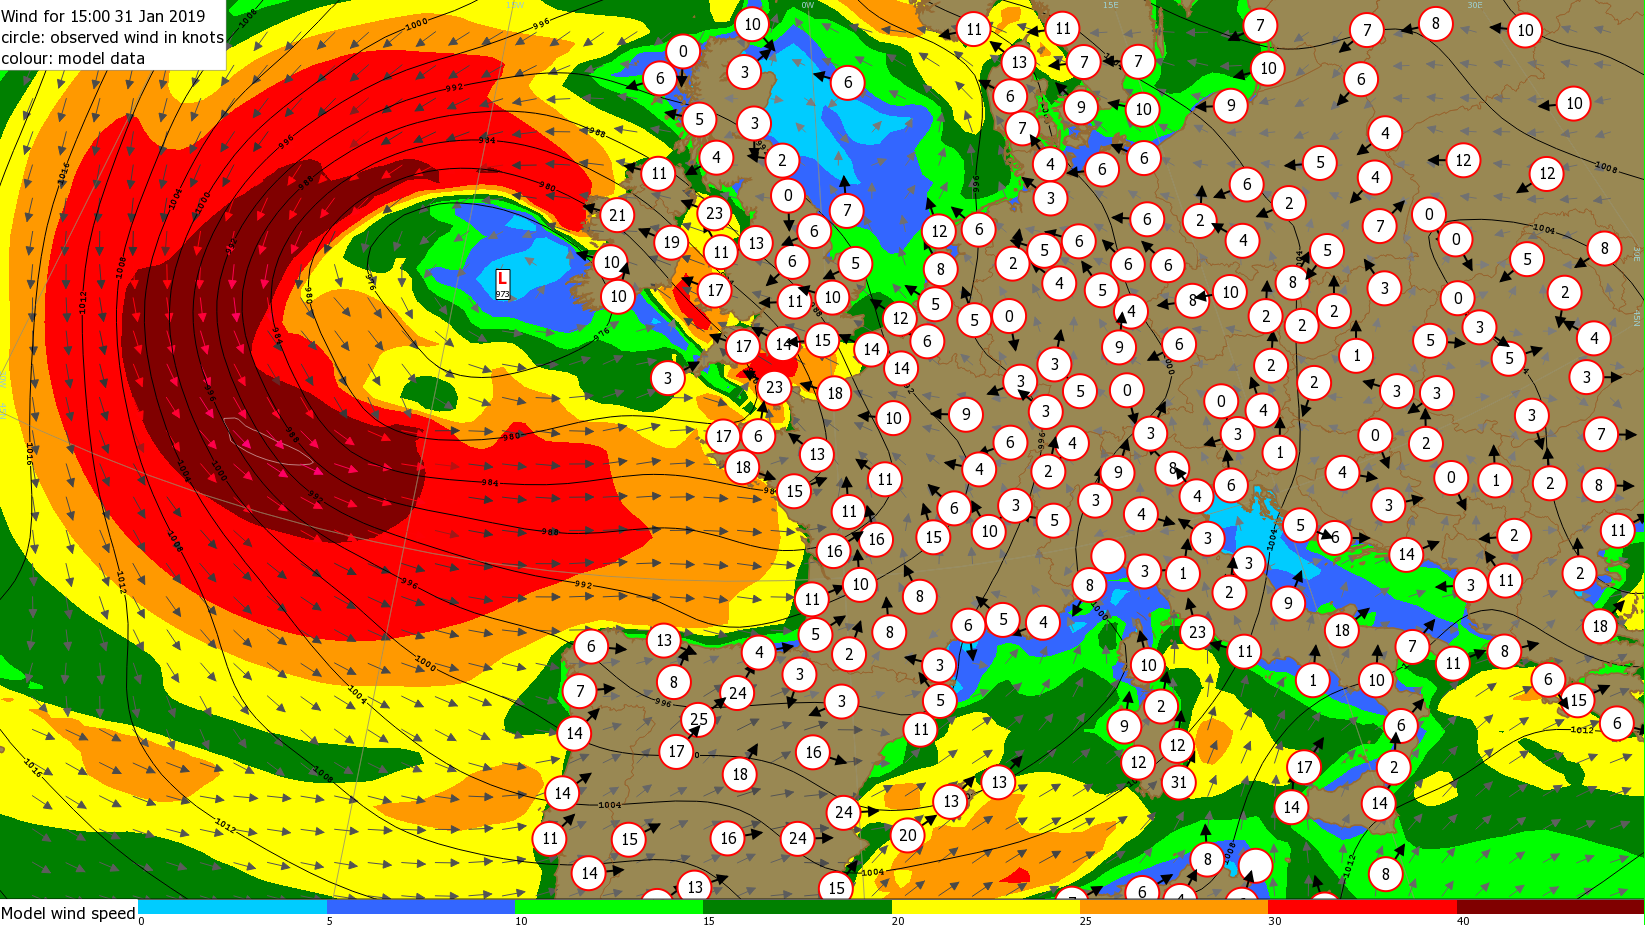
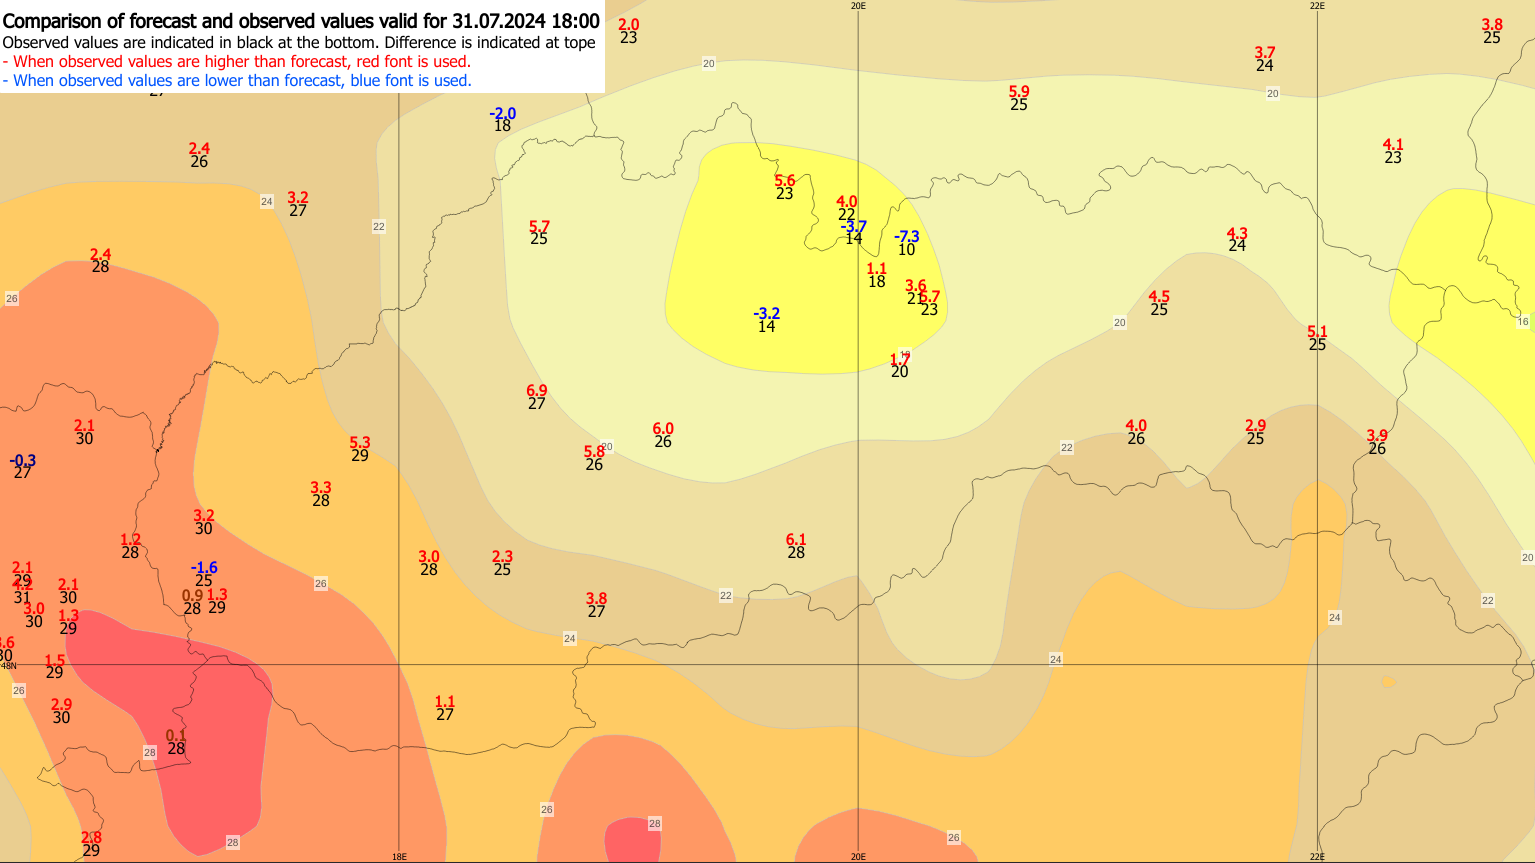
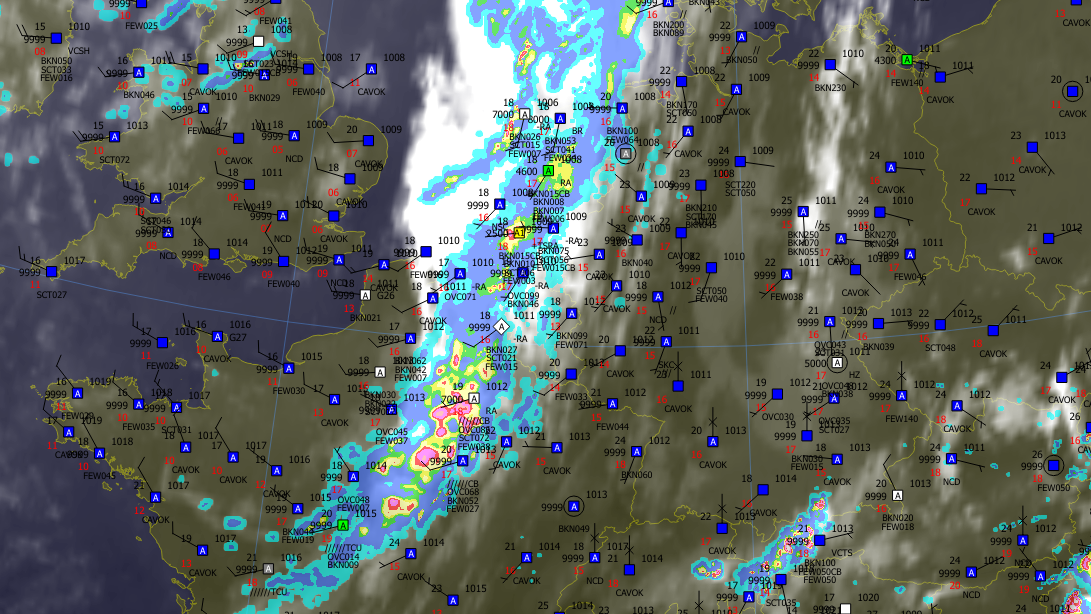
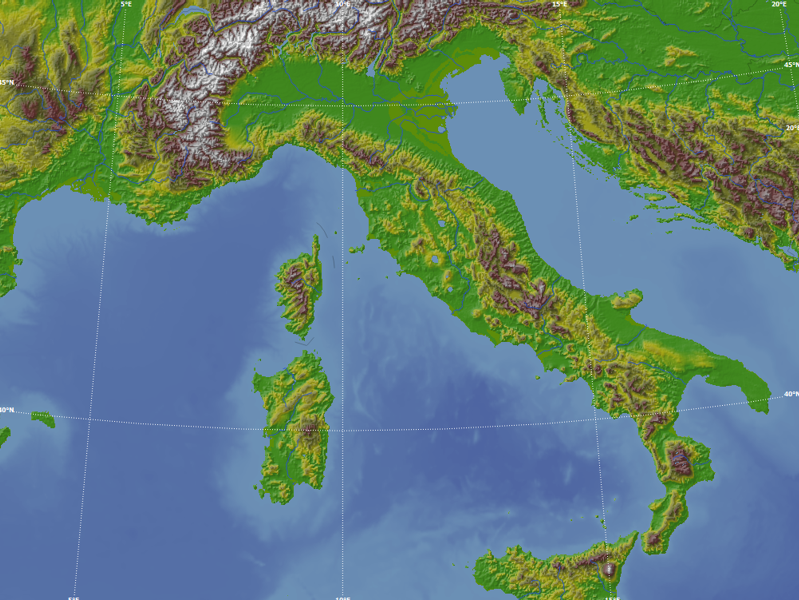
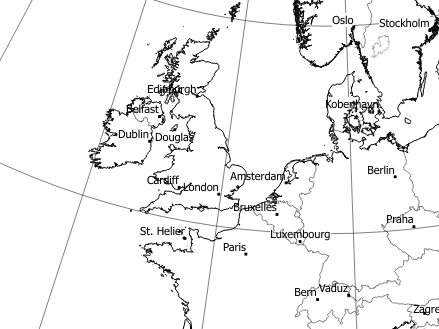
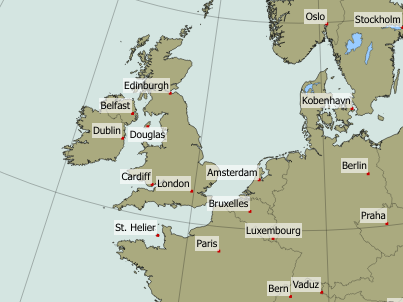
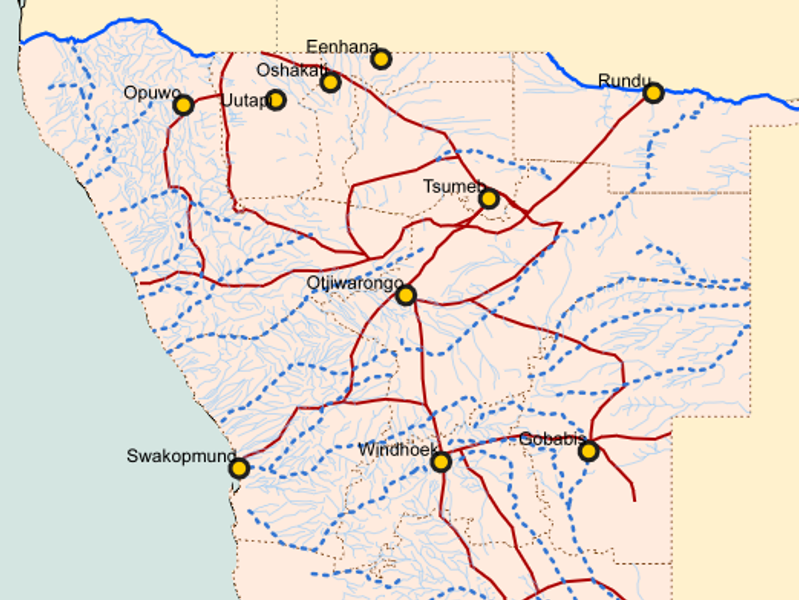
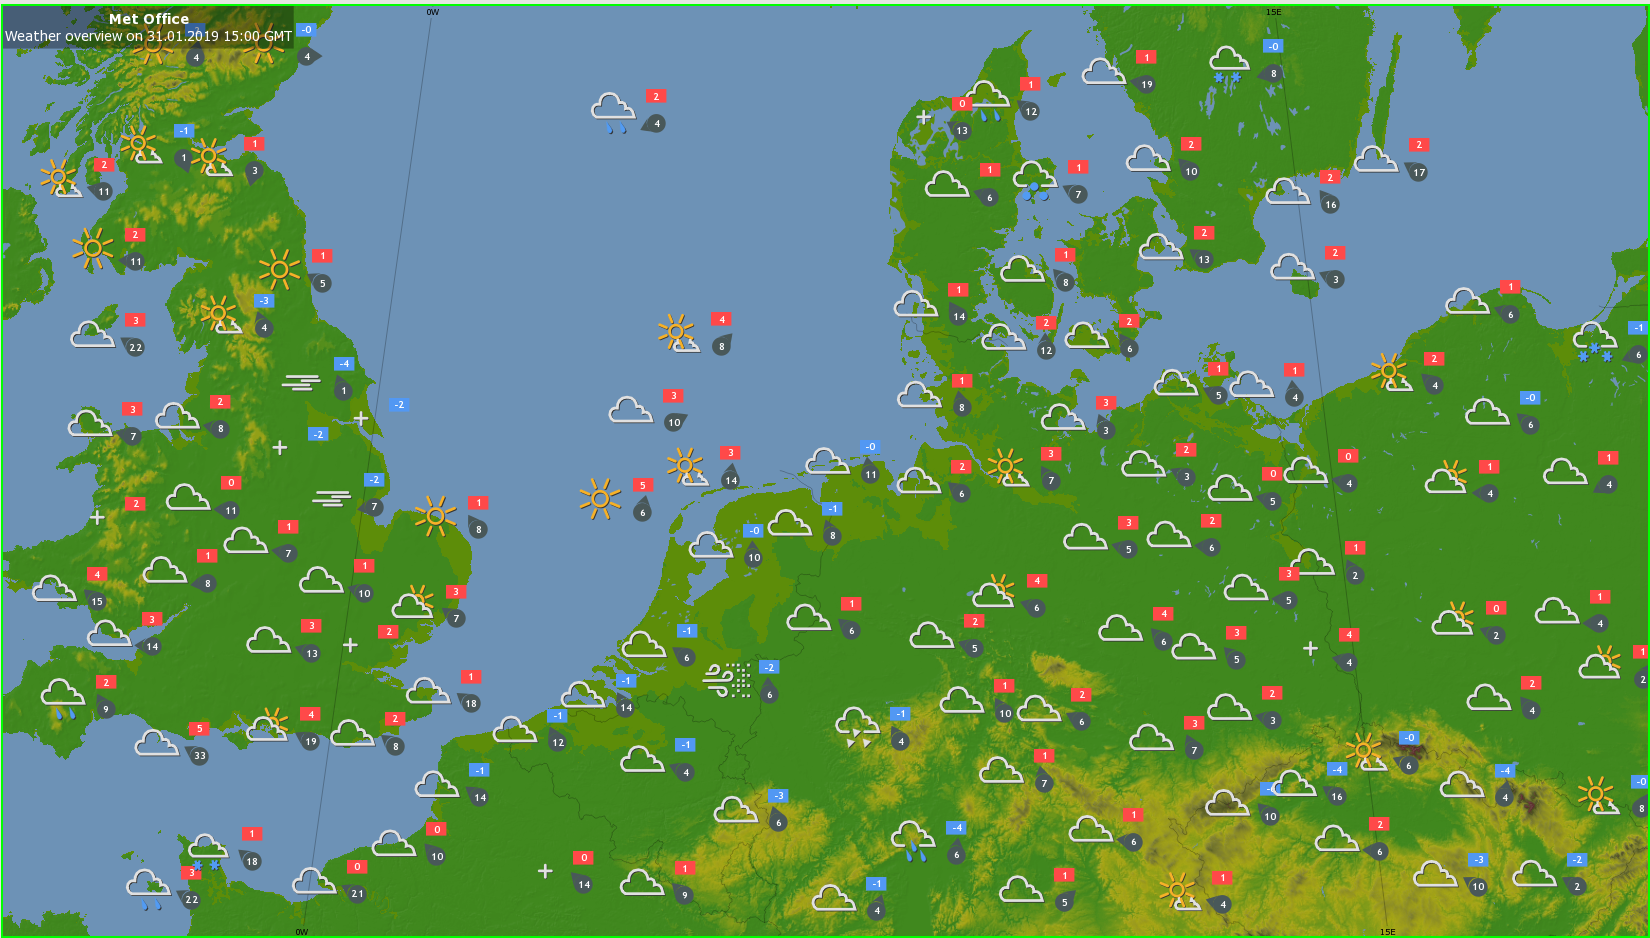
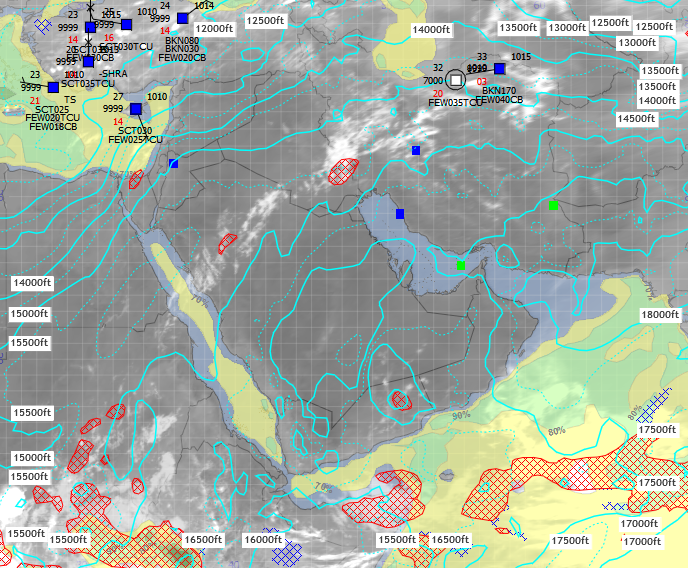
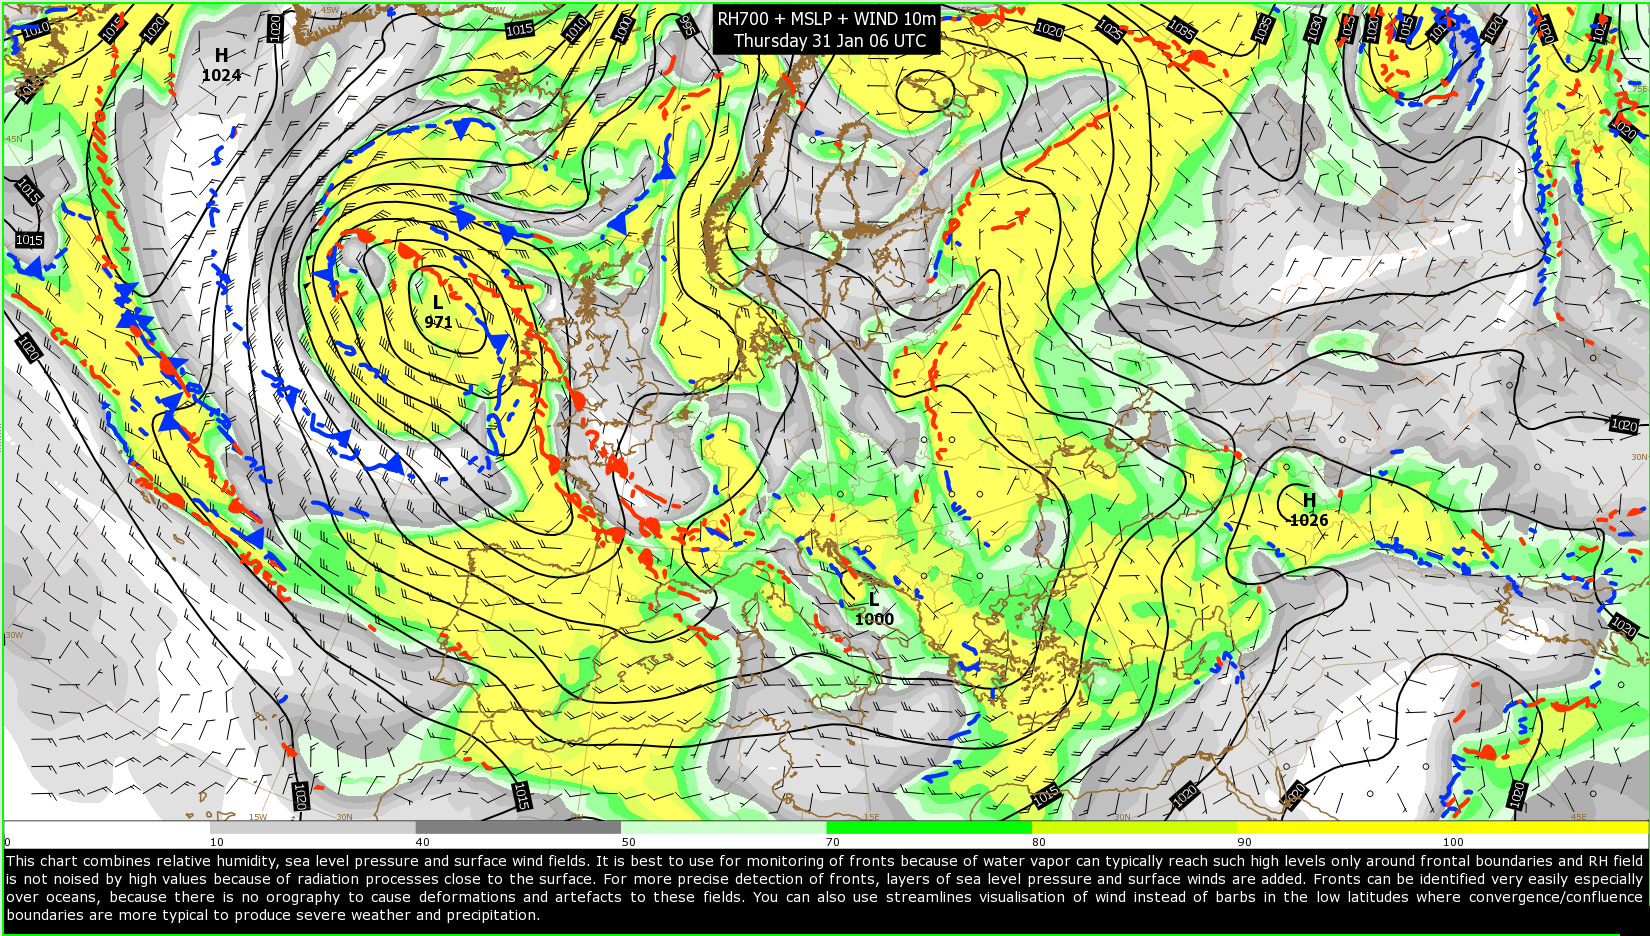
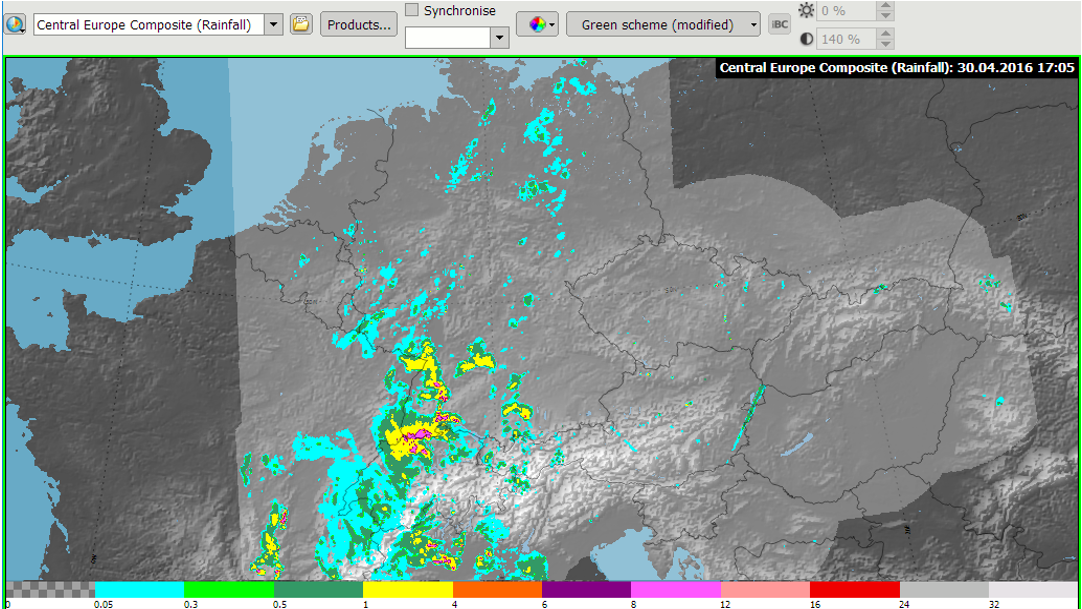
Visual Weather offers a highly customizable interactive map display that seamlessly combines different data types. This capability enables you, for example, to verify model forecasts against real-time observations, augment the view with additional data types, and gain comprehensive insights by integrating various meteorological datasets into a single, coherent visual presentation. Unlimited zooming ensures a clear display of all details, and high-quality images maintain maximum resolution.


Projections, map areas and geographical information

Users can select any area on the globe in real time, with no restriction on the position or the size of the area.

  • Various projections are supported, including Lambert Conic, Mercator, Polar Stereographic and many others
  • High-accuracy GIS data display available for geospatial data of any kind (borders, lakes, cities, etc.)
  • Graphical settings for all displayed elements are adjustable, including the elevation gradients

Visual Weather is delivered with several databases:

  • Geographical database with shorelines, borders and rivers (resolution up to 100 meters)
  • Digital Elevation Model (DEM) with global coverage with 4 km resolution, customisable to 250 meters for  areas
  • City database, WMO and ICAO station catalogues, volcano database, FIR borders, etc.
  • Customer place catalogues can be integrated

Observations: SYNOP, METAR, AWS, TEMP, etc.

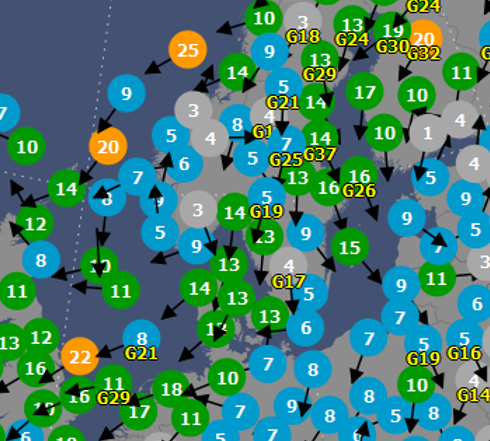
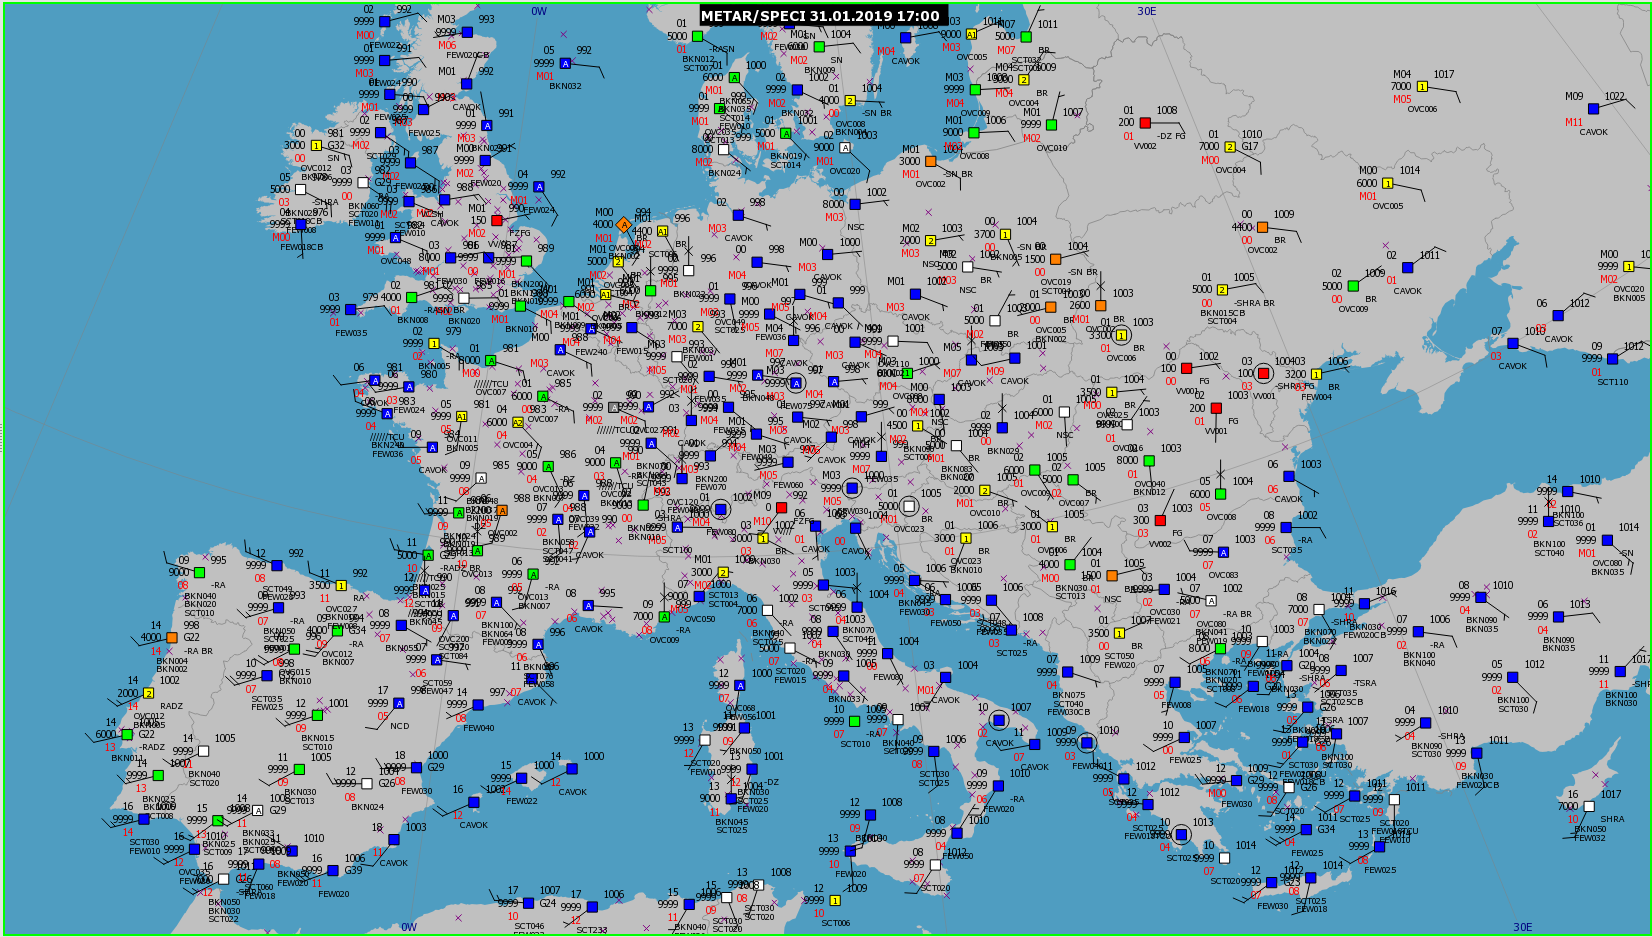
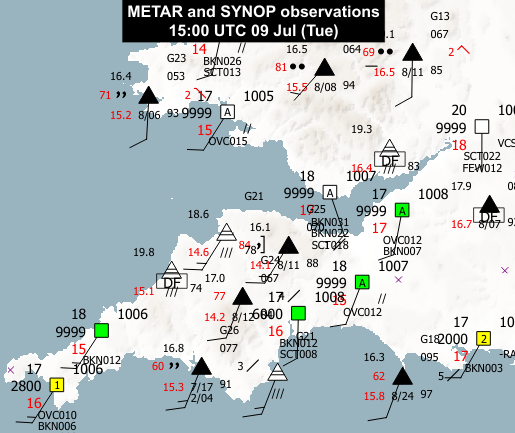
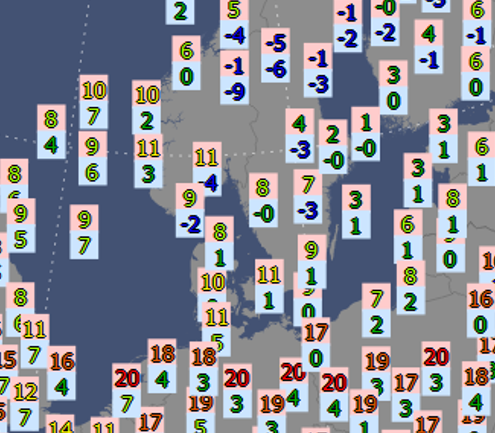
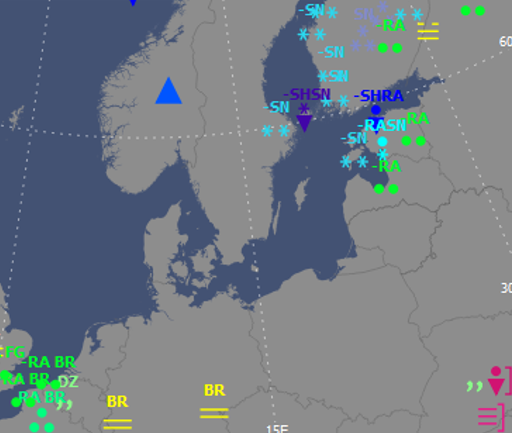
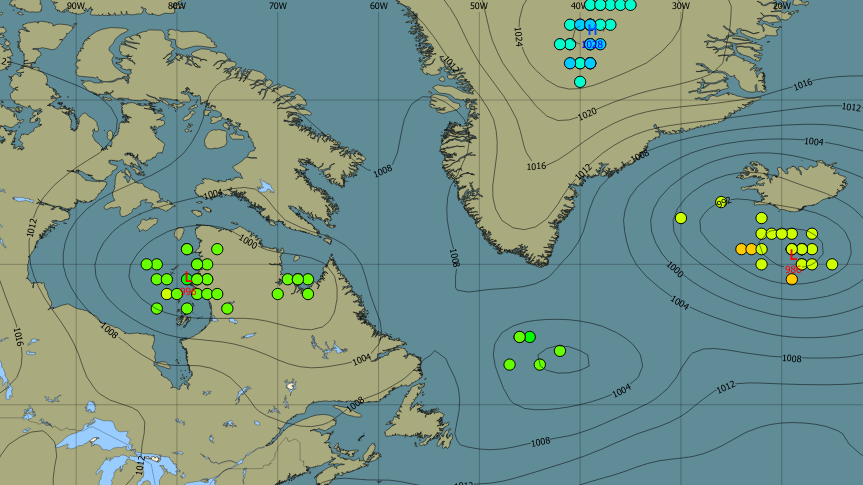
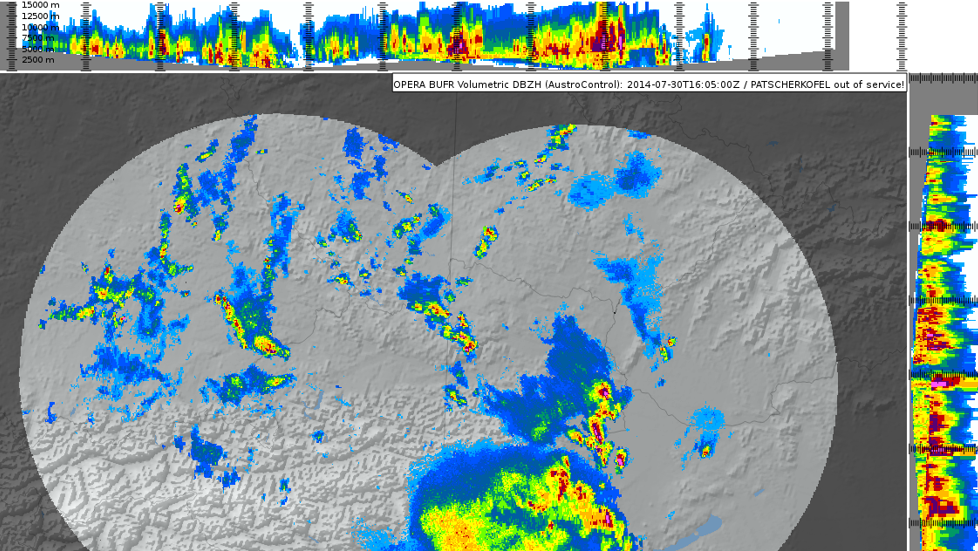
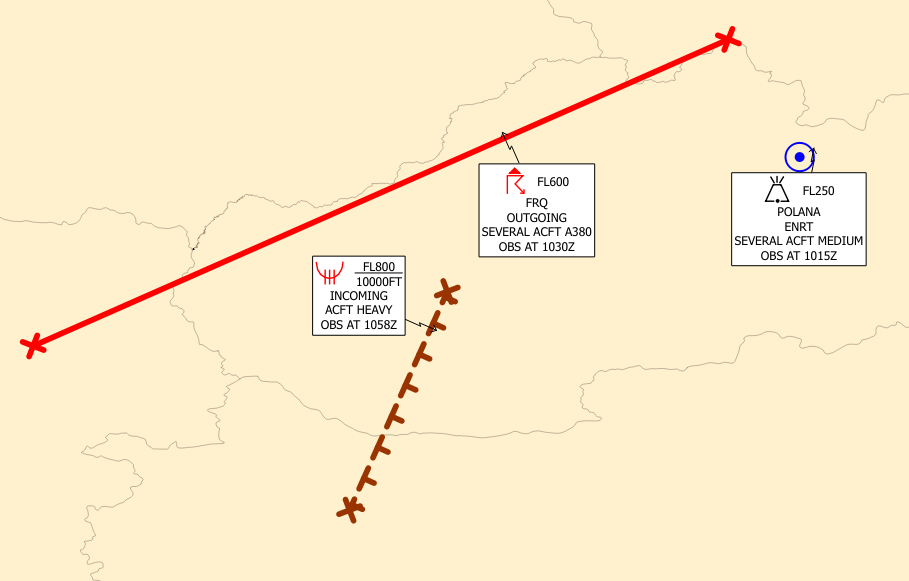
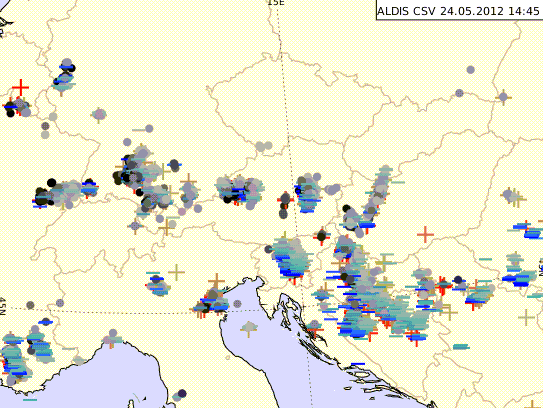
It is possible to display standard observations (METAR, SYNOP, TEMP) and customer-specific observations (AWS, road sensors). Supported formats include TAC, IWXXM and BUFR. Observations can be displayed in a variety of ways:

  • as standard station plots or weather icons generated based on values
  • individual parameters using colour gradients, e.g. wind speed using colours for easy identification of thresholds
  • custom visualisation for calculated parameters, such as daily min and max temperatures
  • objective analysis of observations

Deterministic NWP Models

  • Parameters from atmospheric, wave, dispersion and nowcasting (rapid-update) models in GRIB2, NetCDF-CF or HDF5
  • Visualized models are not restricted by specific area or projection - Visual Weather displays global models (such as GFS, ECMWF, Unified Model, ICON, WAFS model from WAFC London and Washington) and regional or locally computed models (WRF, INCA, HIRLAM, and others)
  • Visualization includes isolines (contours) and isosurfaces, wind barbs, arrows or streamlines,  numerical grid, weather symbols
  • The graphical settings of the visualization styles are fully customizable

Compare data from different models

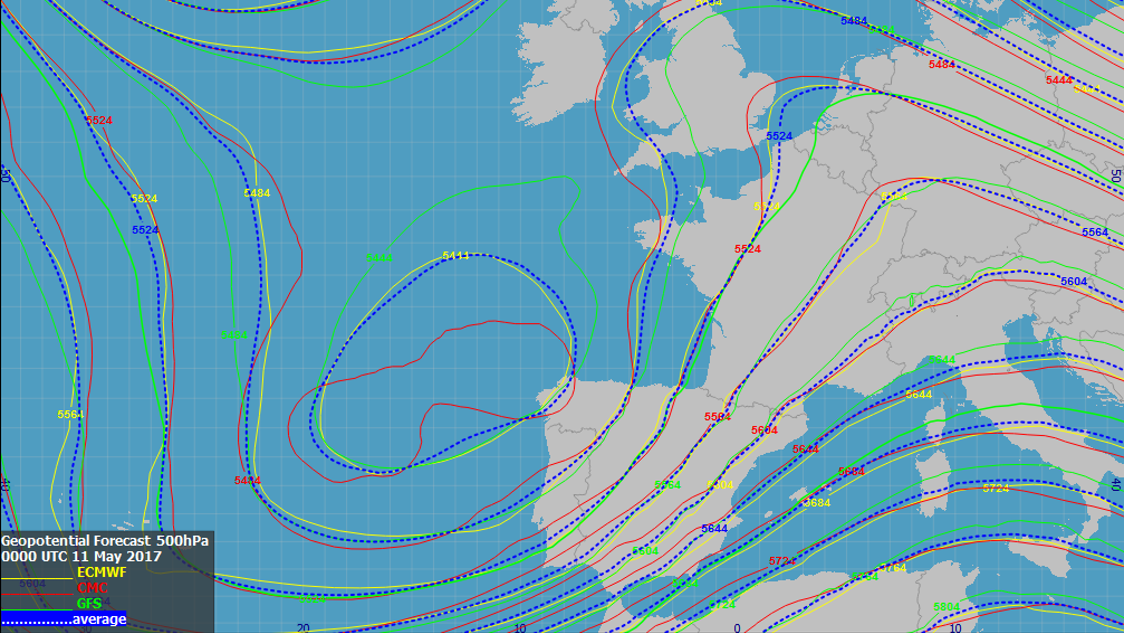
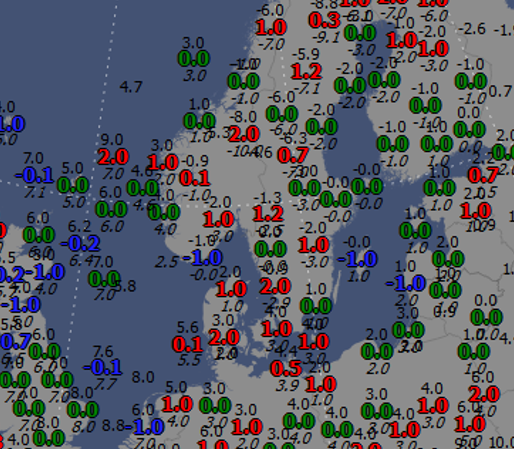
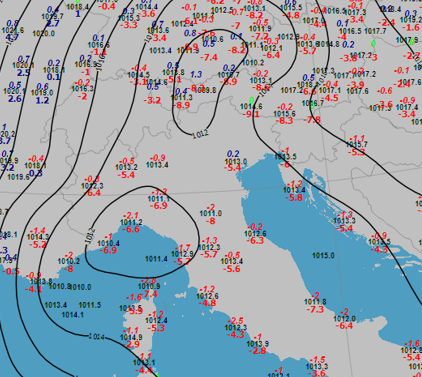
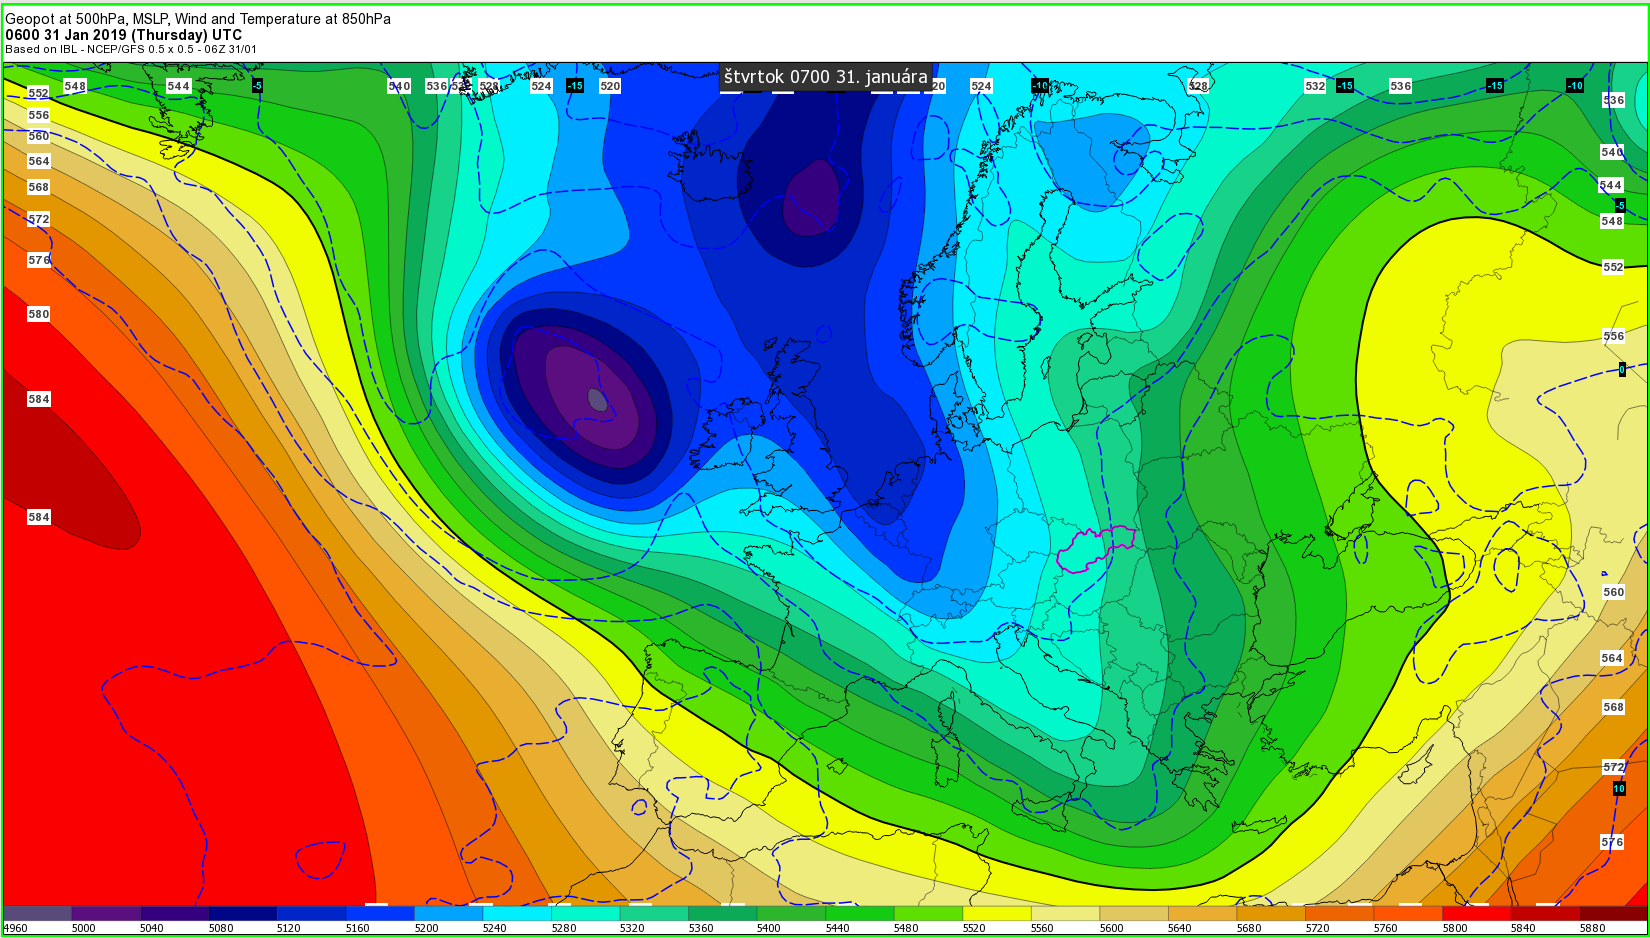
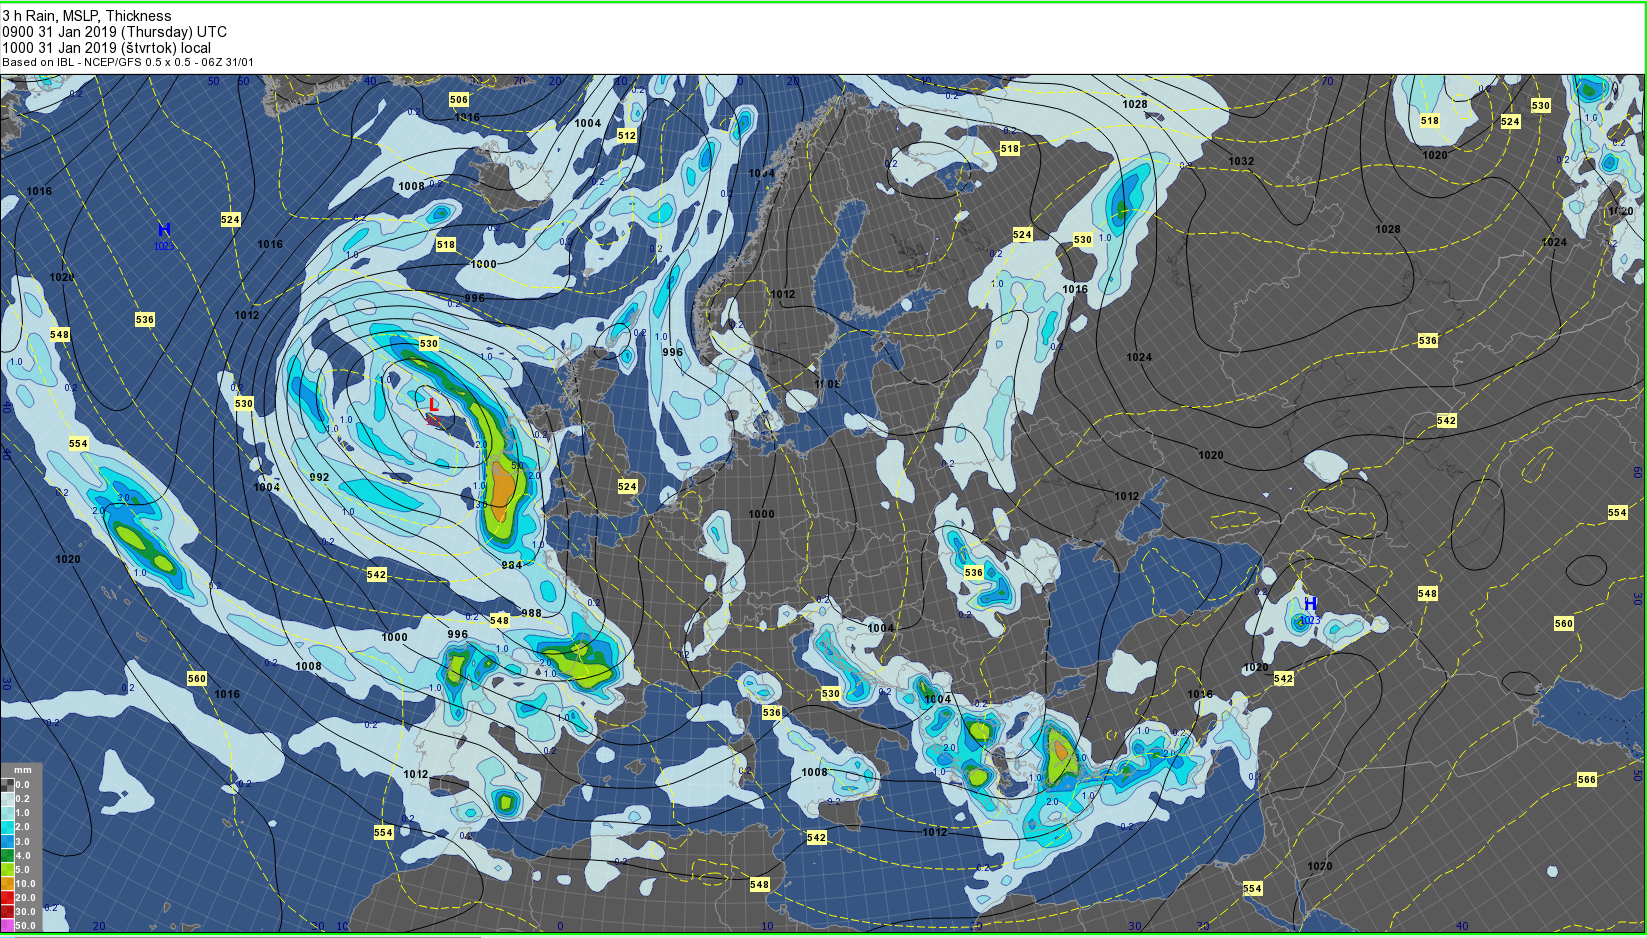
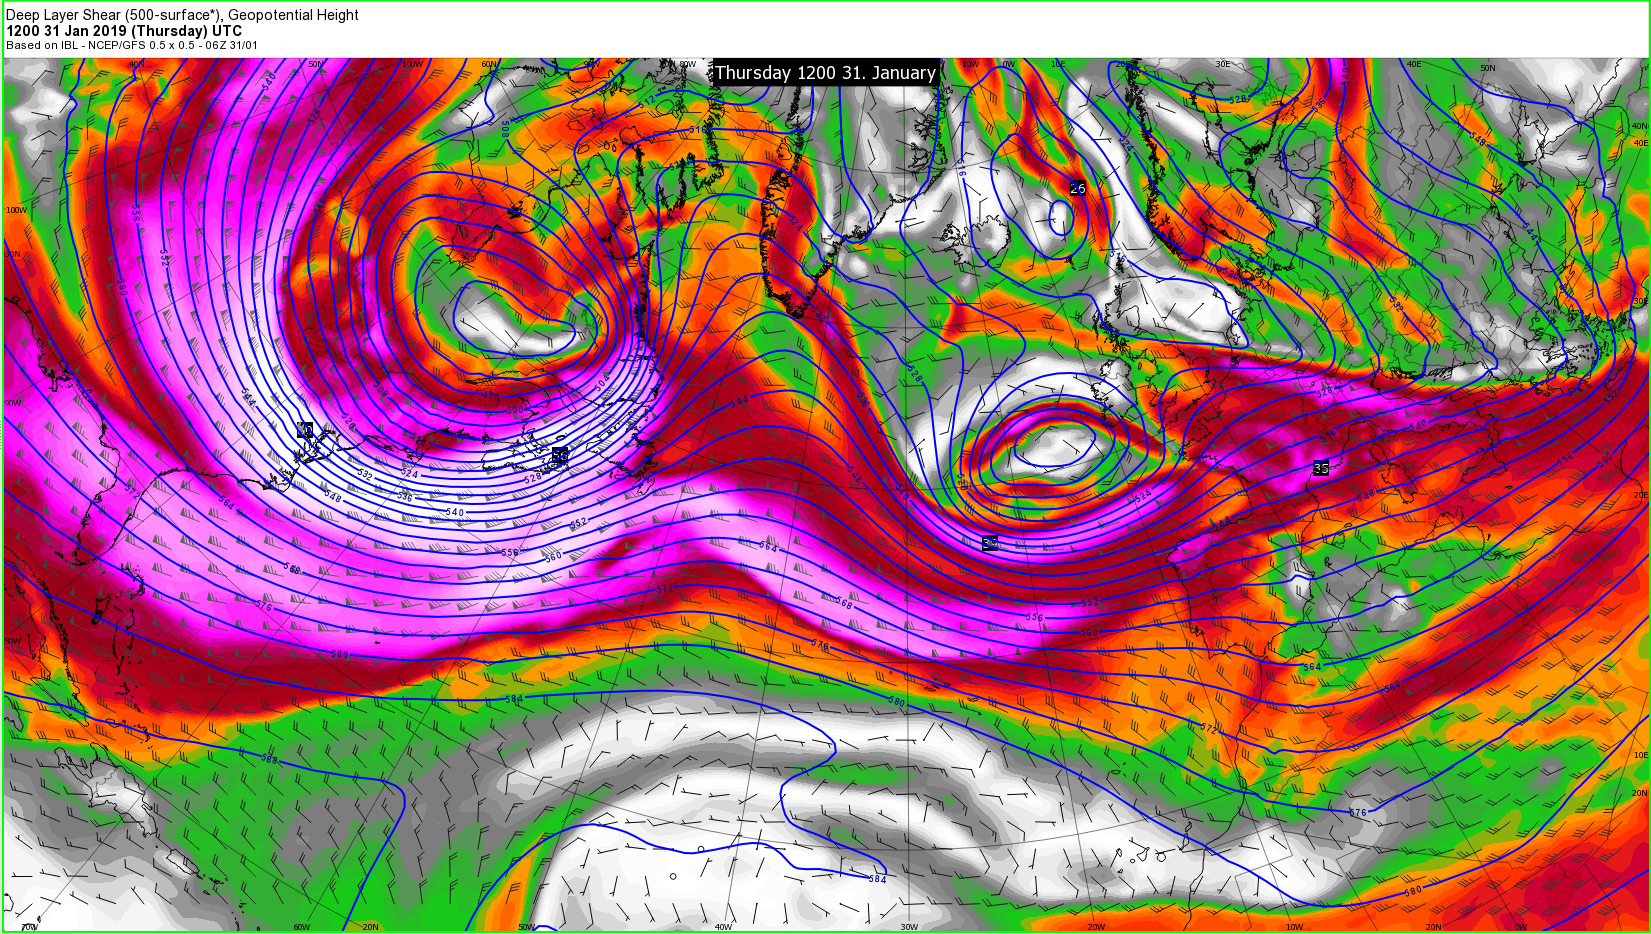
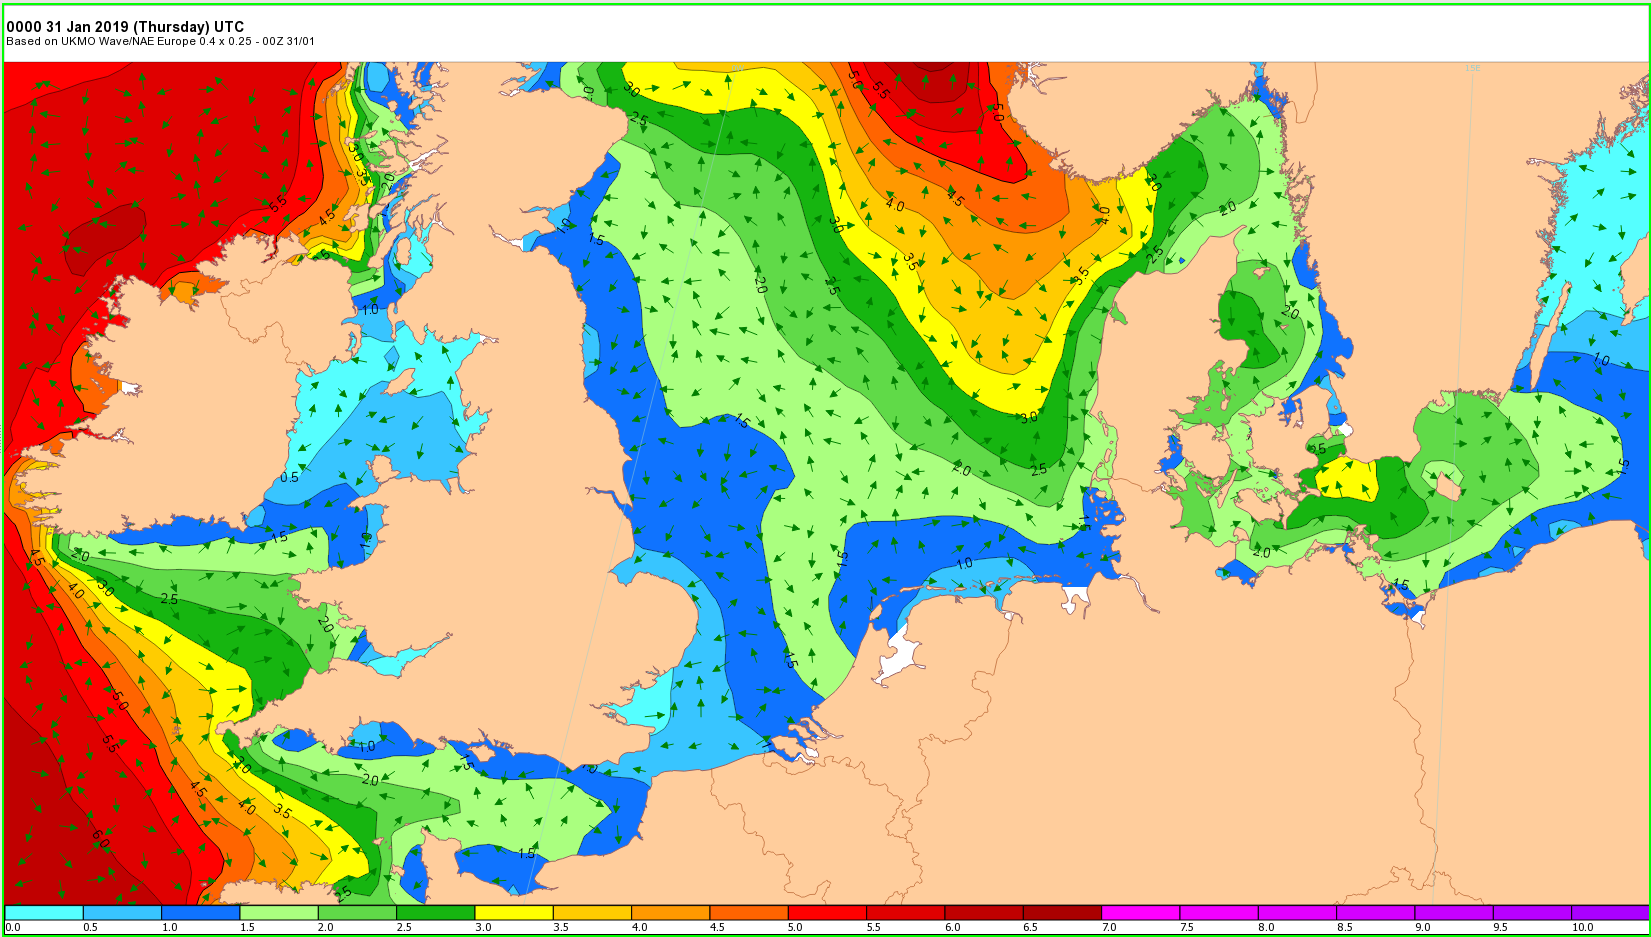
It is possible to overlay data from various models, regardless of the different resolution used by these models, and visualise the difference between models or calculate and display the average values from different models.

Easily display accumulations, max or min

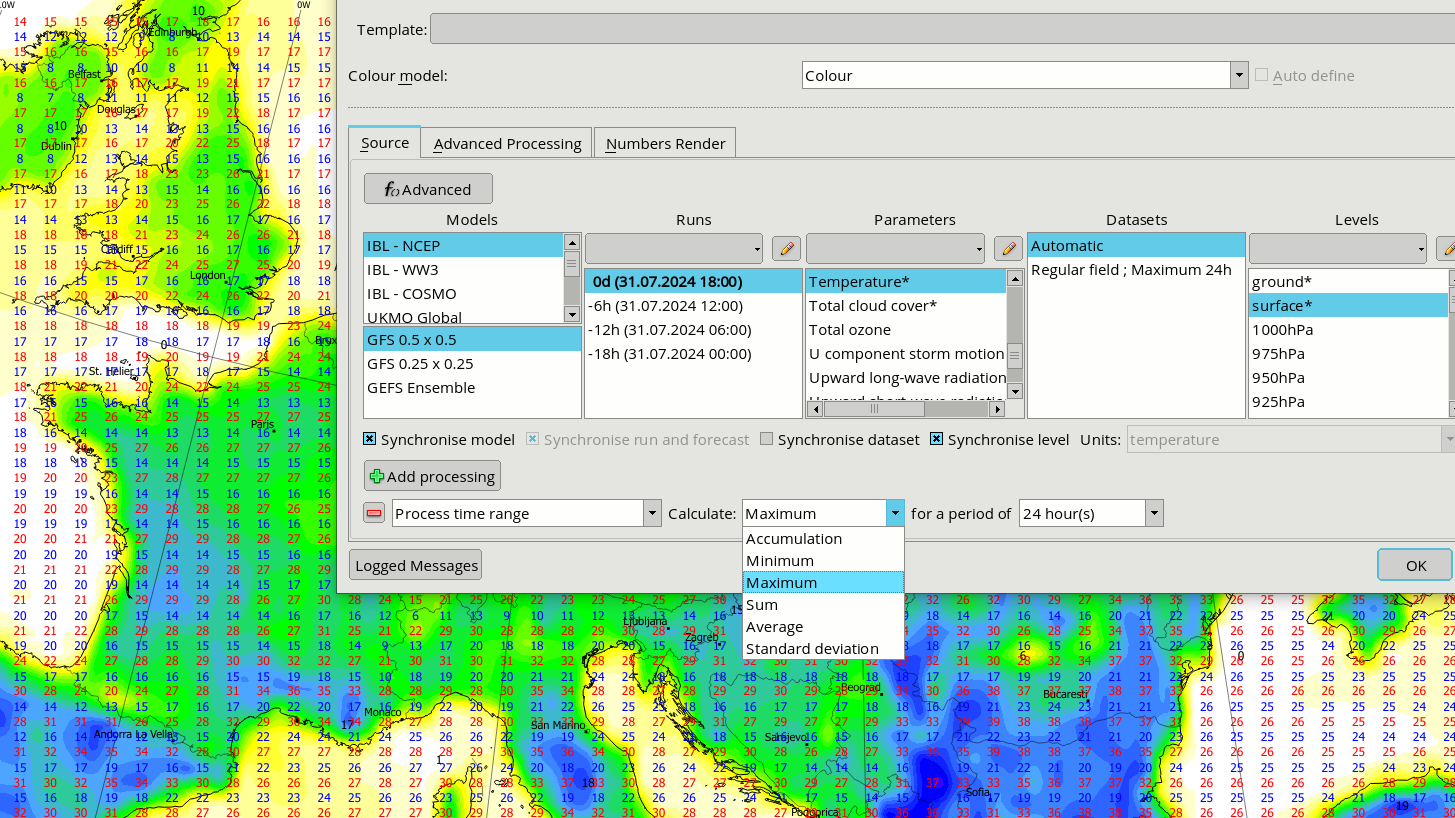
The interface allows you to select a time periodicity and select what processing type you want to use to instantly display the accumulation, minimum or maximum, from a selected time period.

Ensemble Models

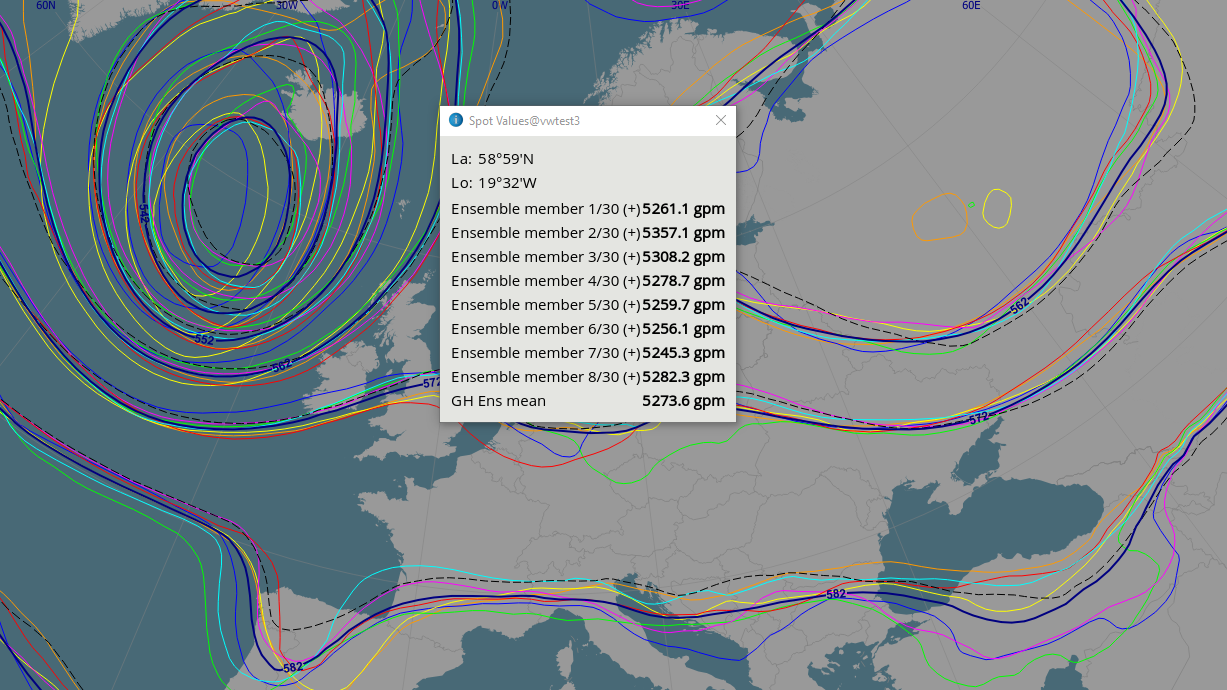
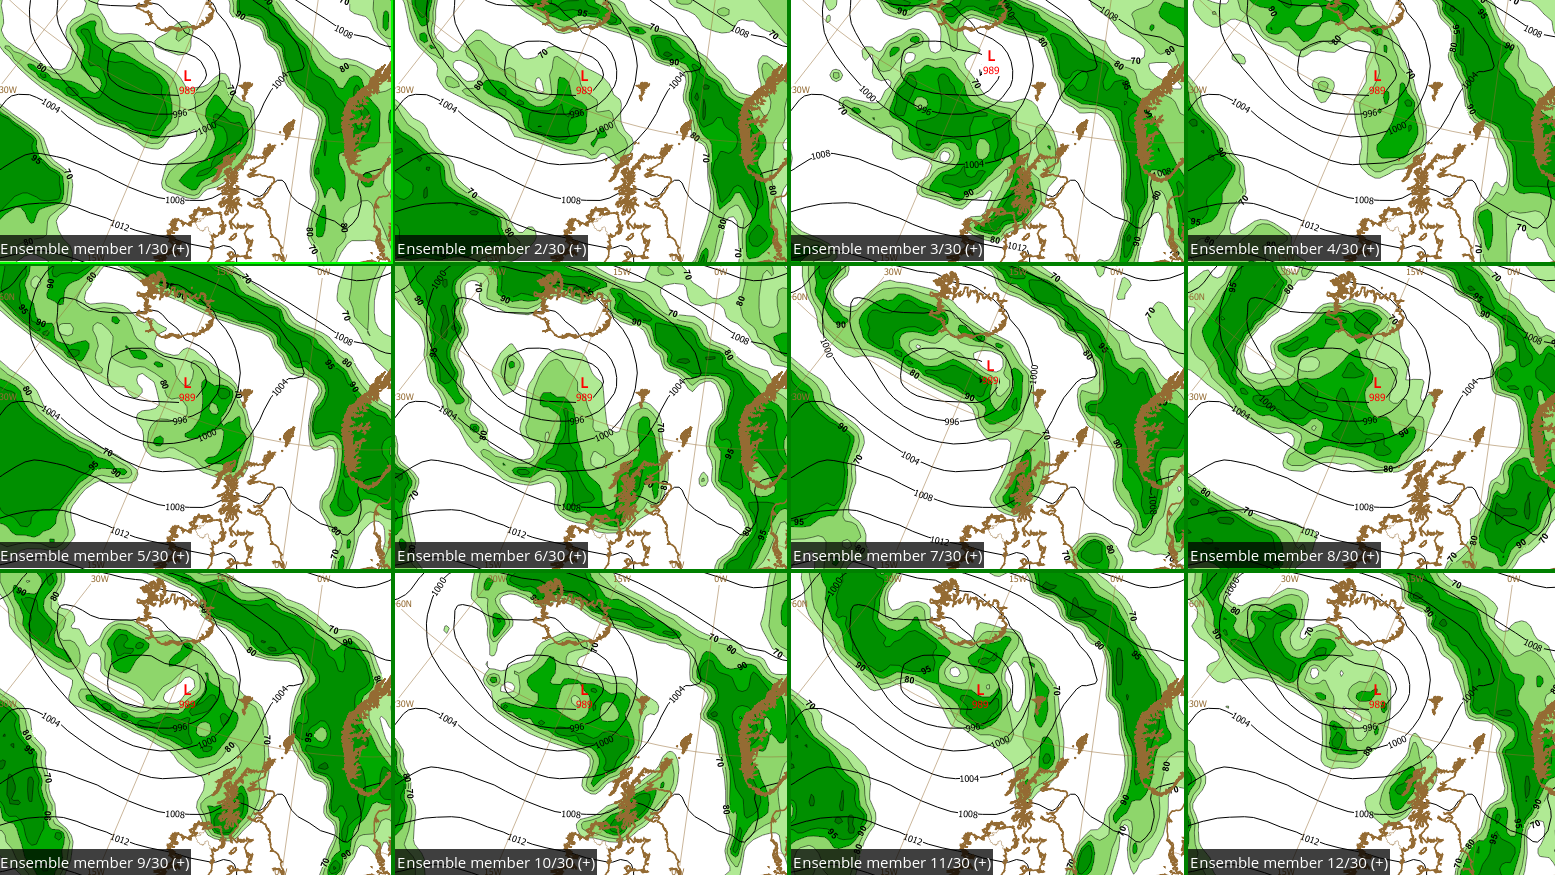
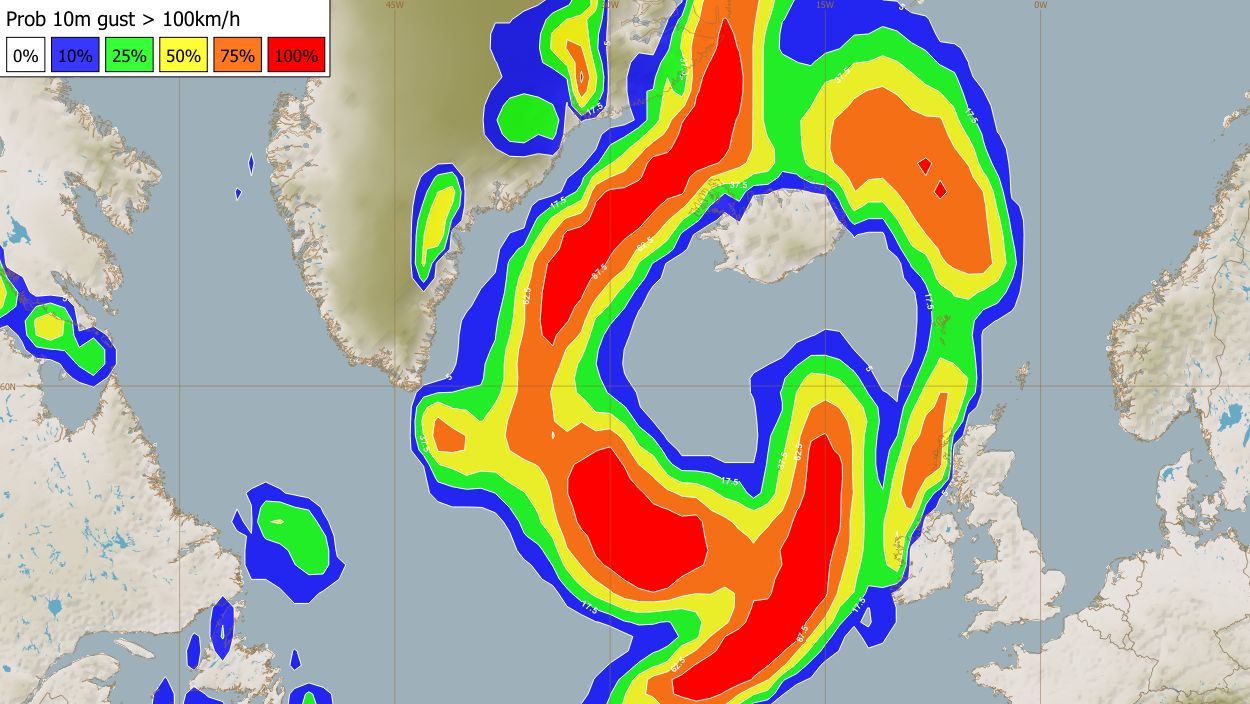
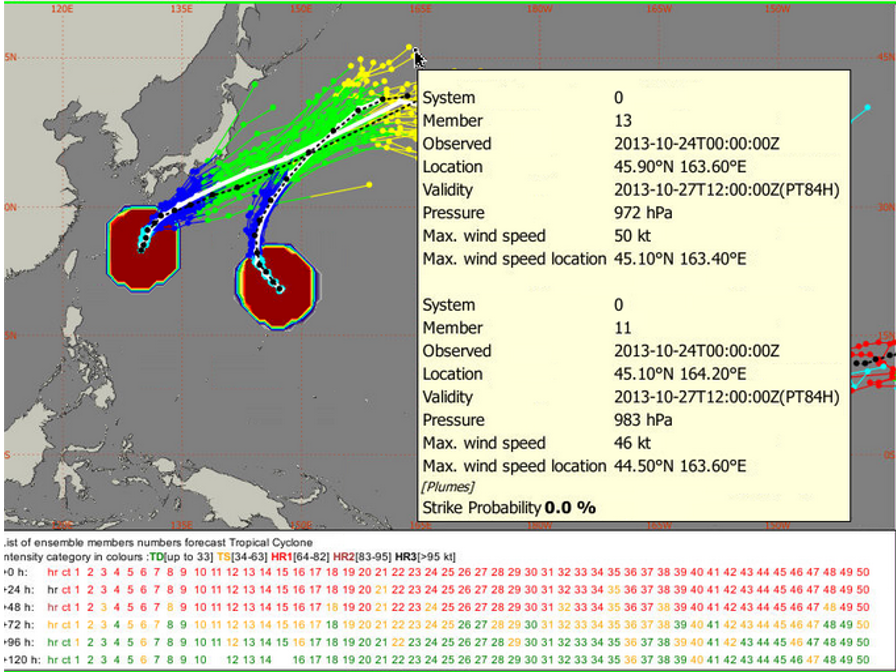
Ensemble model data can be displayed in a variety of ways:

  • selected ensemble member
  • spaghetti plots: overlay of several ensemble members on one map for easy comparison
  • percentile forecasts
  • confetti plots: areas where members reached the specified threshold
  • probability of the forecast reaching a specified threshold
  • postage stamps: all members of the ensemble forecast as a multiview display
  • display the minimum/maximum/average of all ensemble members

Satellite Data

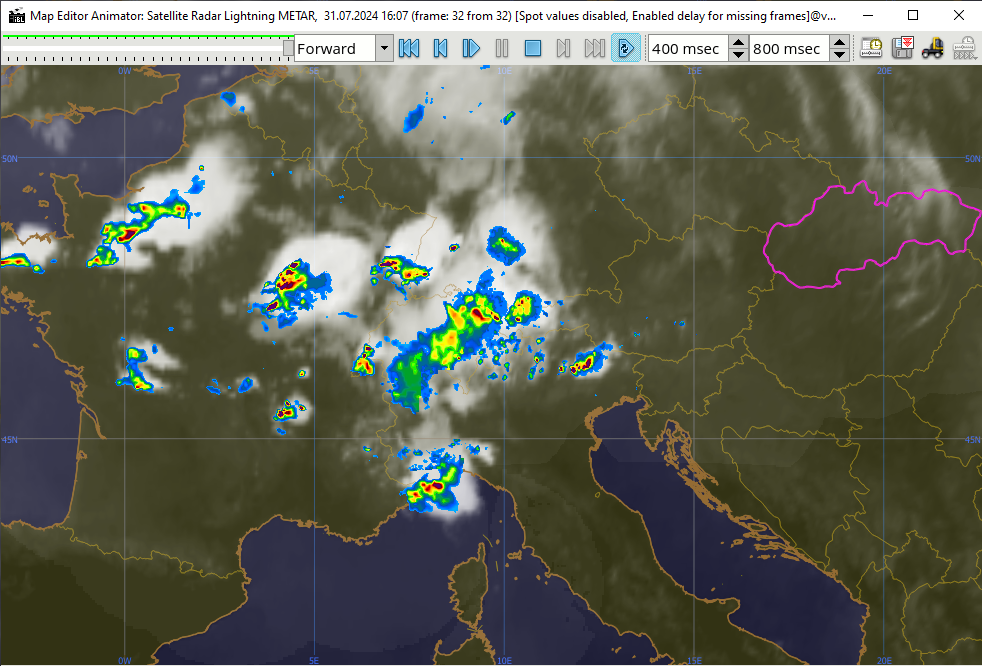
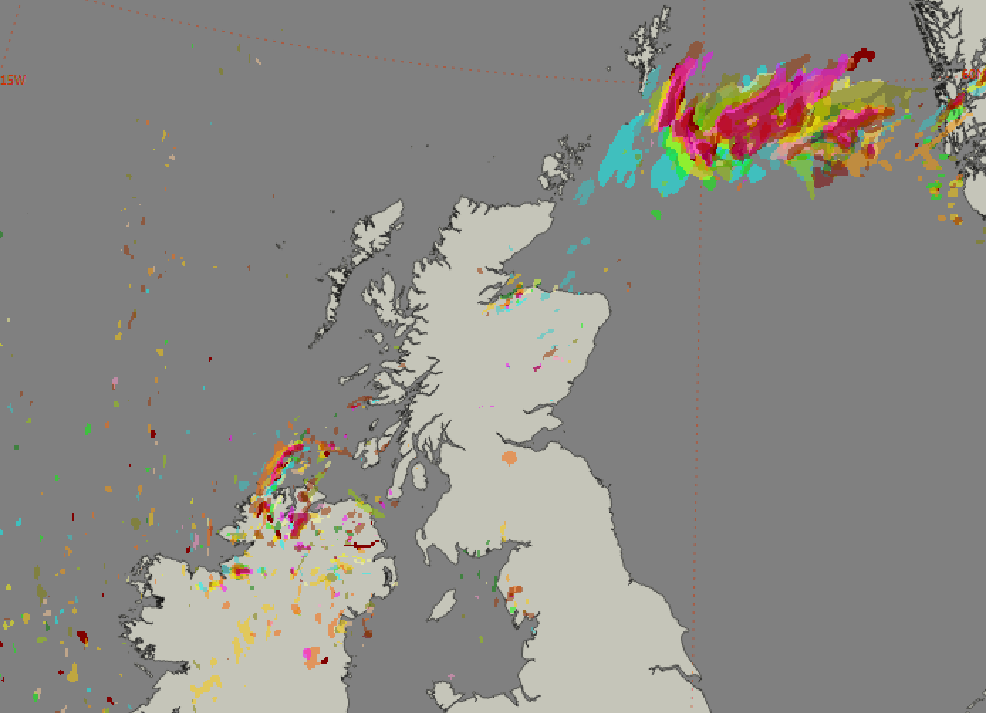
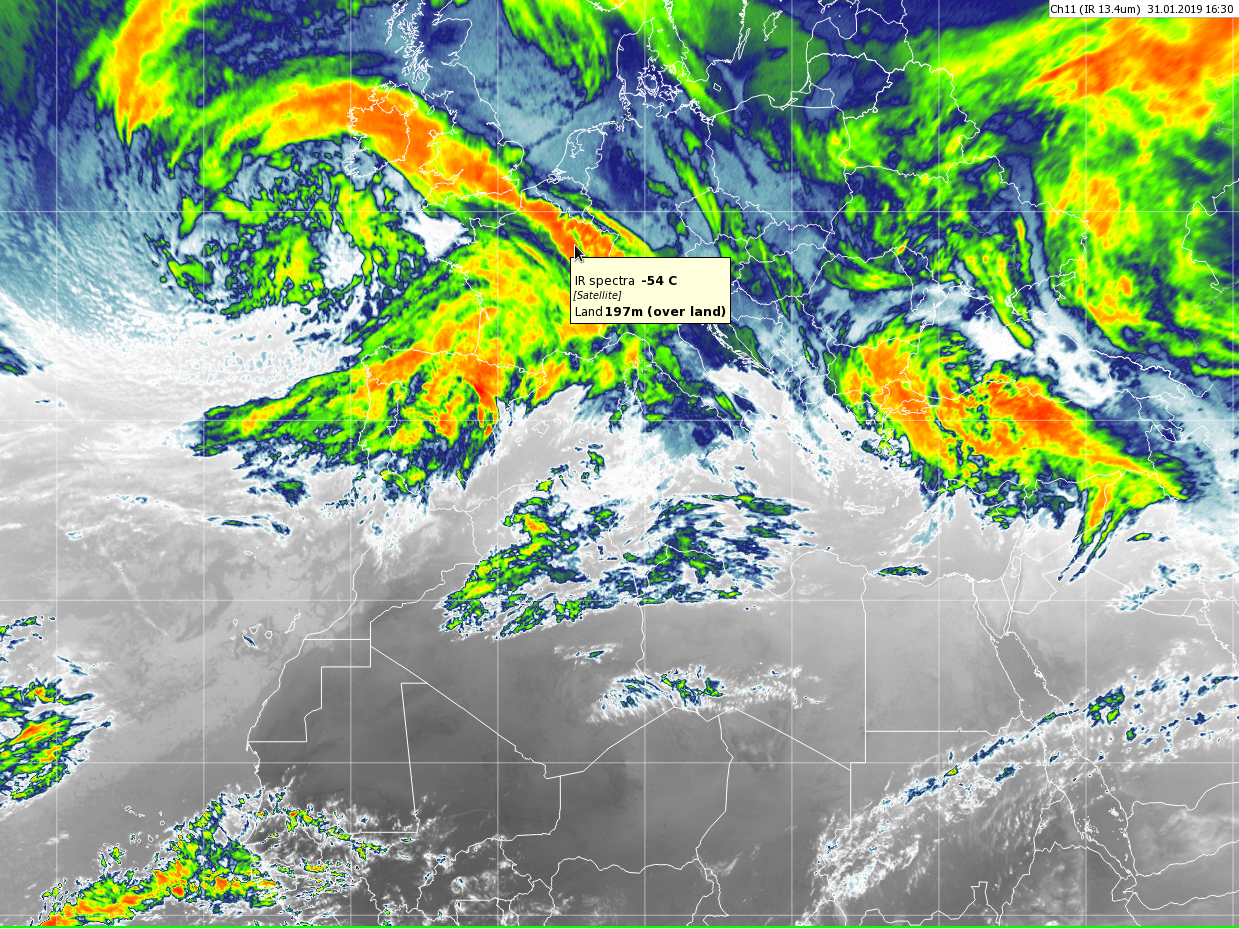
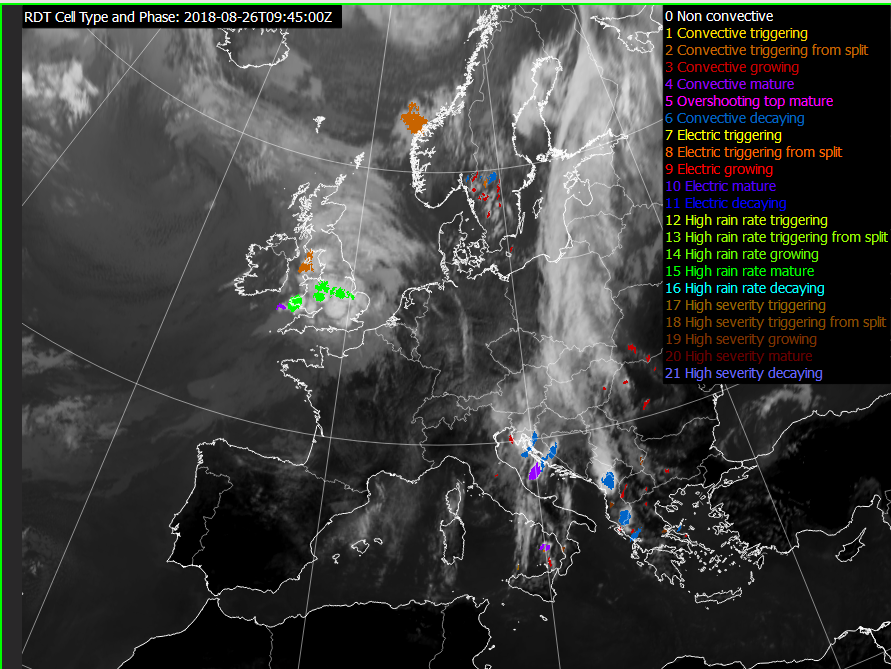
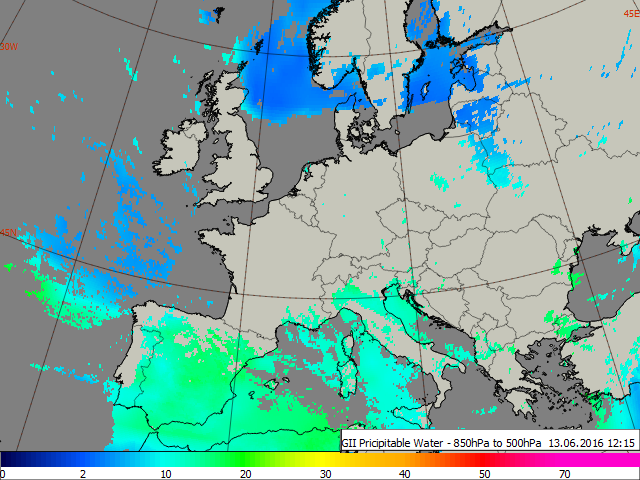
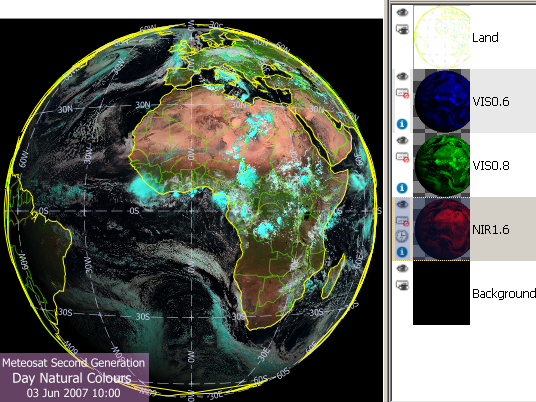
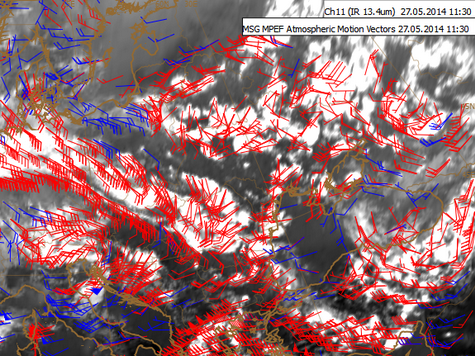
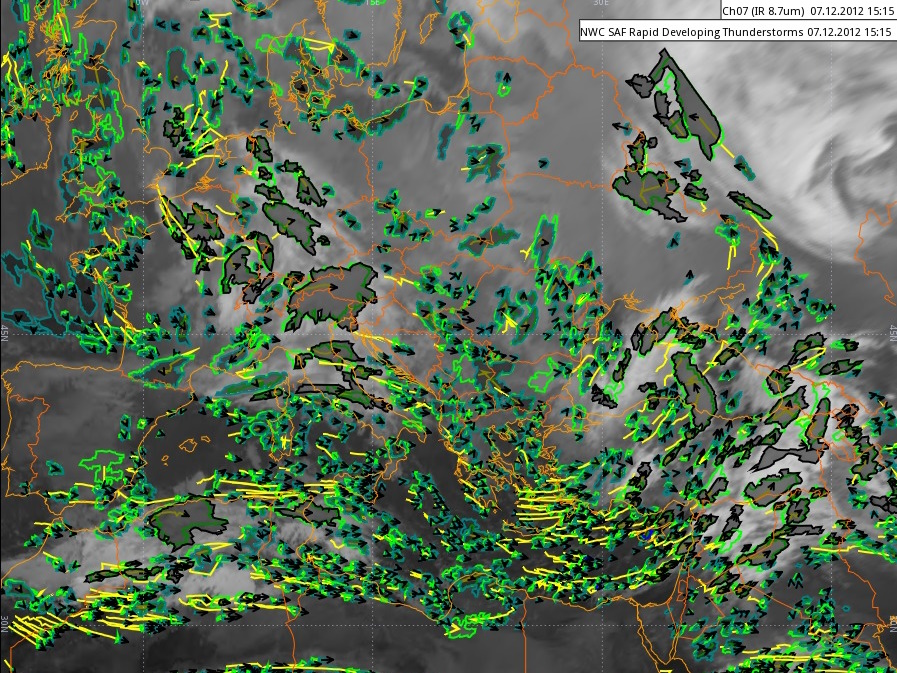
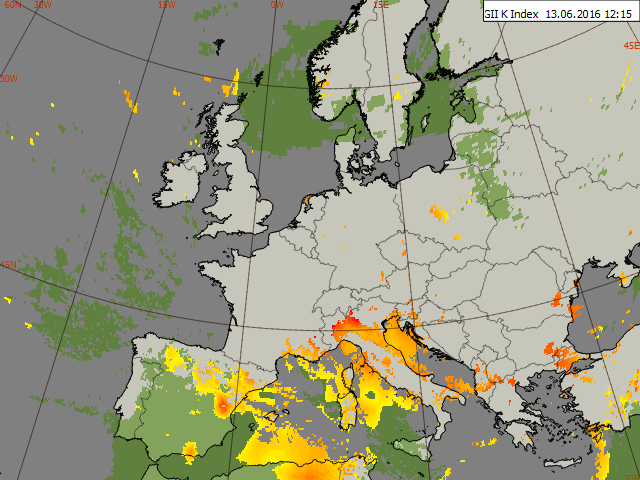
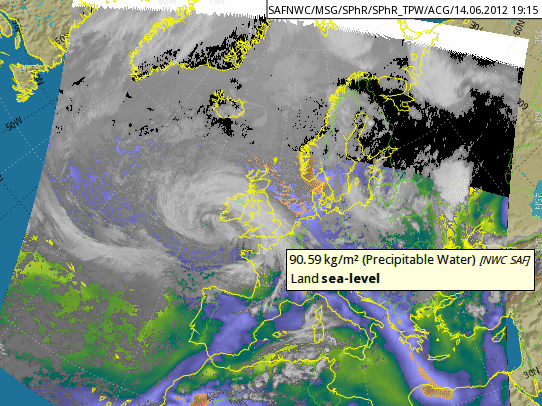
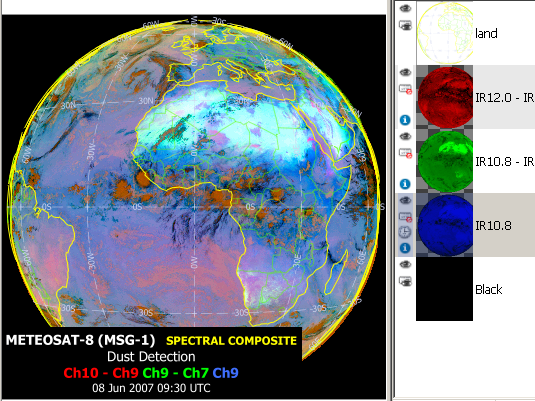
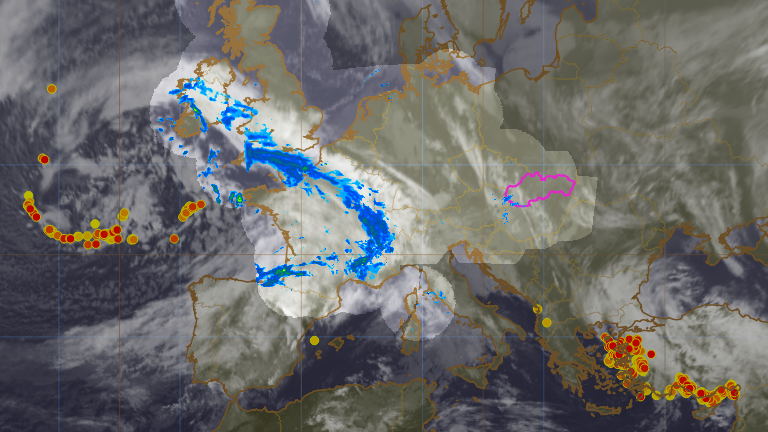
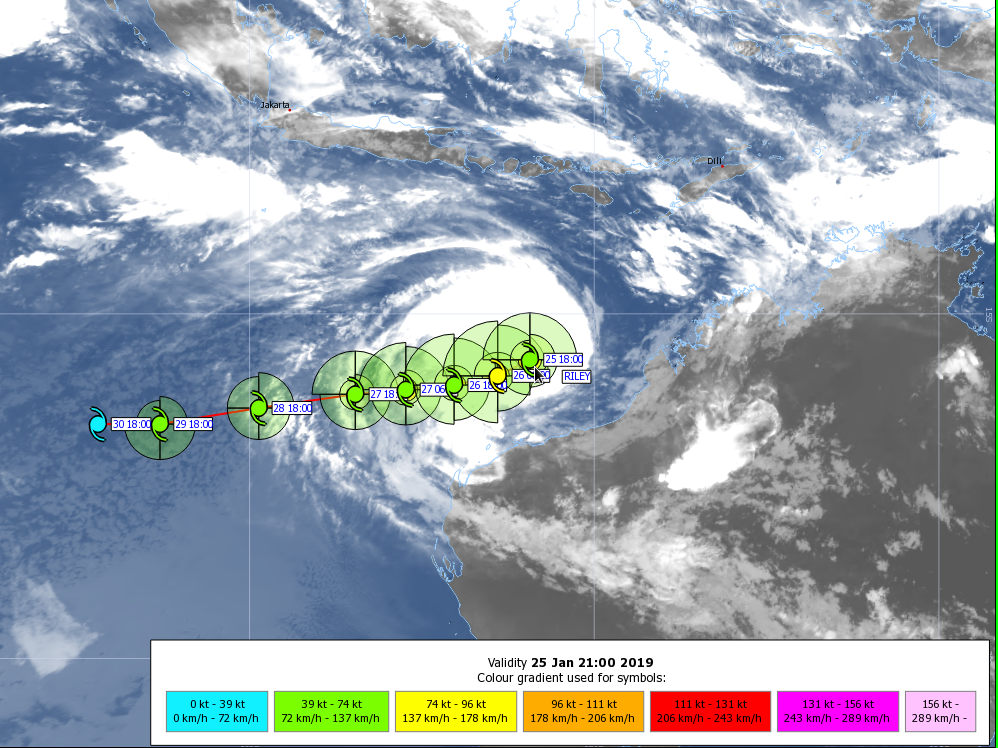
Visual Weather displays a wide range of satellite data: geostationary, polar, RGB composites, and derived satellite products. It supports standard data formats as well as formats produced by common vendors of satellite-receiving equipment. For raw data of Meteosat Second (MSG) & Third Generation (MTG) distributed on EUMETCast we offer our Satellite Weather product as a receiver and post-processor to prepare the imagery for visualisation.

  • Primary input formats are WMO GRIB2 & NetCDF CF
  • Geostationary Eumetsat MSG, IODC, MTG, JMA Himawari (Satellite Weather needed as a preprocessor)
  • Geostationary GOES-R 16/17 (NetCDF CF)
  • 3rd party integration (GeoTIFF, McIDAS AREA, McIDAS AVHRR, UK AutoSat, VCS/2met XPIF, Kongsberg MEOS HDF5)
  • Nowcasting SAF (NWC SAF GEO)
  • Land Surface Analysis SAF (LSA SAF)
  • Ocean & Sea Ice SAF (OSI SAF)
  • EUMETSAT MPEF derived products
  • Ocean surface winds (ASCAT, OSCAT)
  • NOAA Hydro-Estimator
  • GLM satellite lightnings

Radar Data

  • Supported formats include OPERA 3 BUFR format, ODIM BUFR or HDF5 data (polar volumetric), TITAN MDV,  EEC EDGE NetCDF (polar sweeps and derived products), Gamic Enigma HDF5 Polar.
  • Users can interactively change the radar source, colour scheme, and for the volumetric multi-elevation polar data (3D radar) select elevation angle or altitude (in case of CAPPI/PPI top view) and use side views as a vertical cross-section.

SIGWX, SIGMET, AIREP

  • SIGWX BUFR from WAFC center can be displayed for any selected area, with option to adjust the visualisation settings.
  • Supported IWXXM SIGWX standard
  • SIGMET, AIRMET and Special AIREP display highlights the related FIR, shows the exact location of the phenomenon and displays the details both as labels and tooltip.

and much more (lightning, web, custom data, etc.)

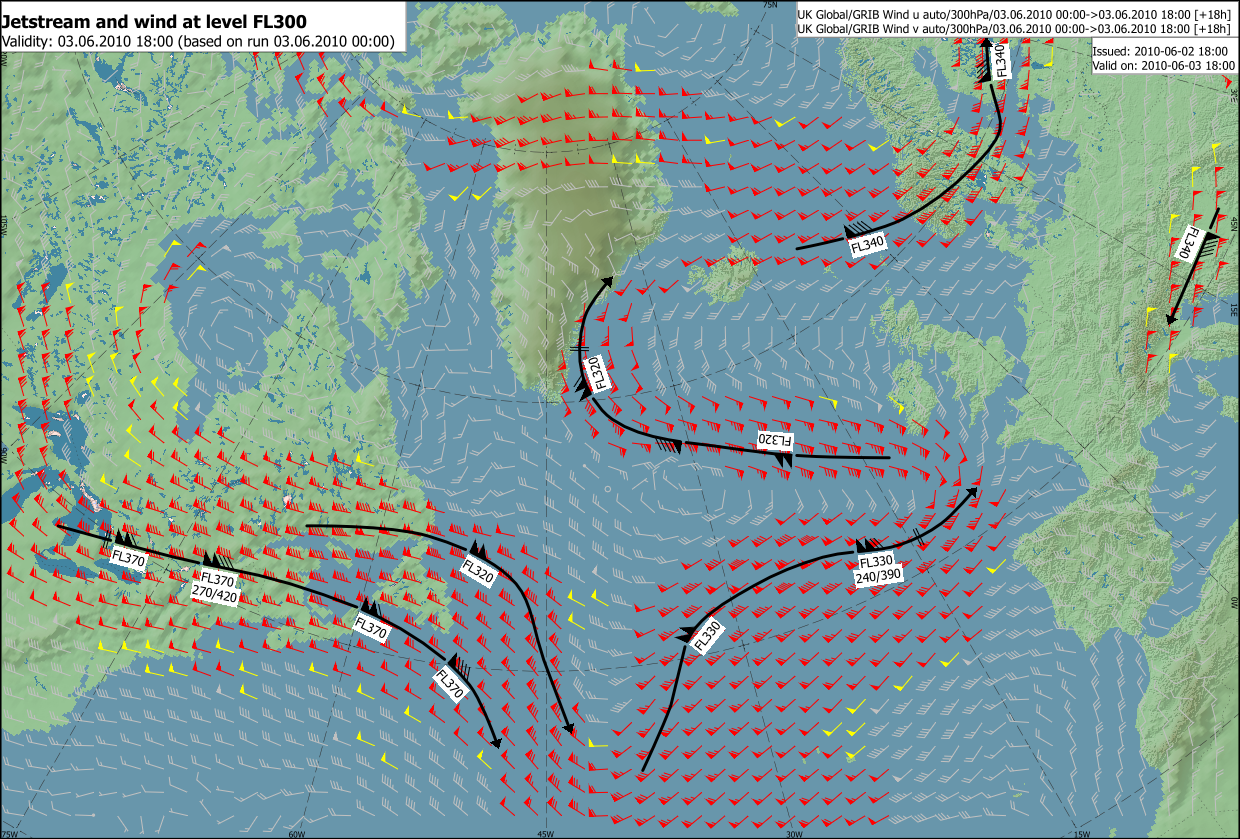
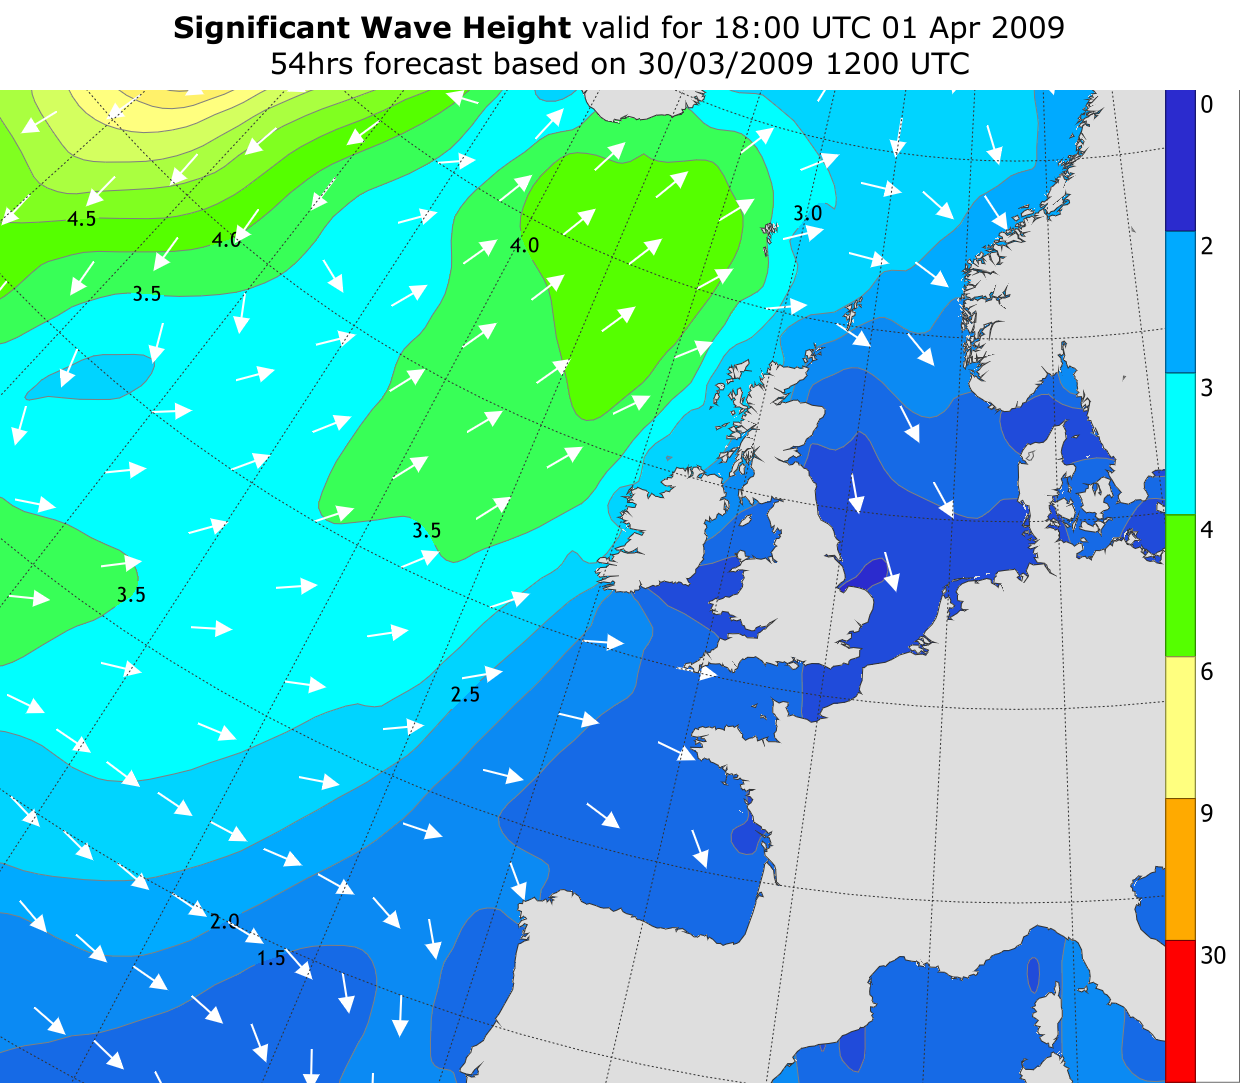
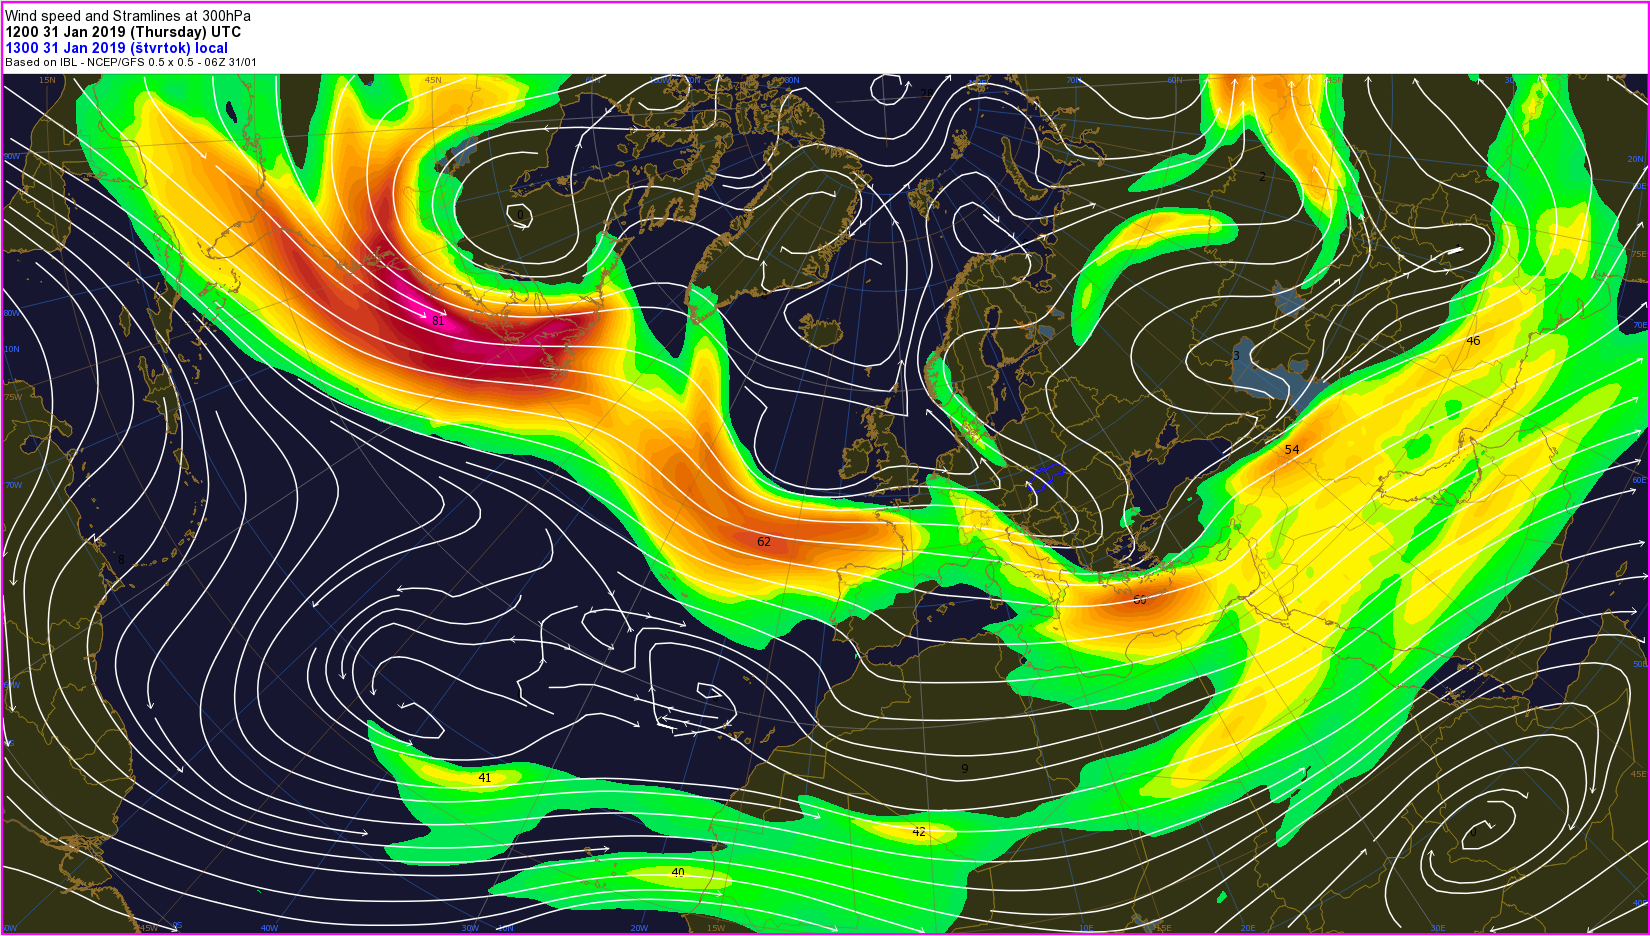
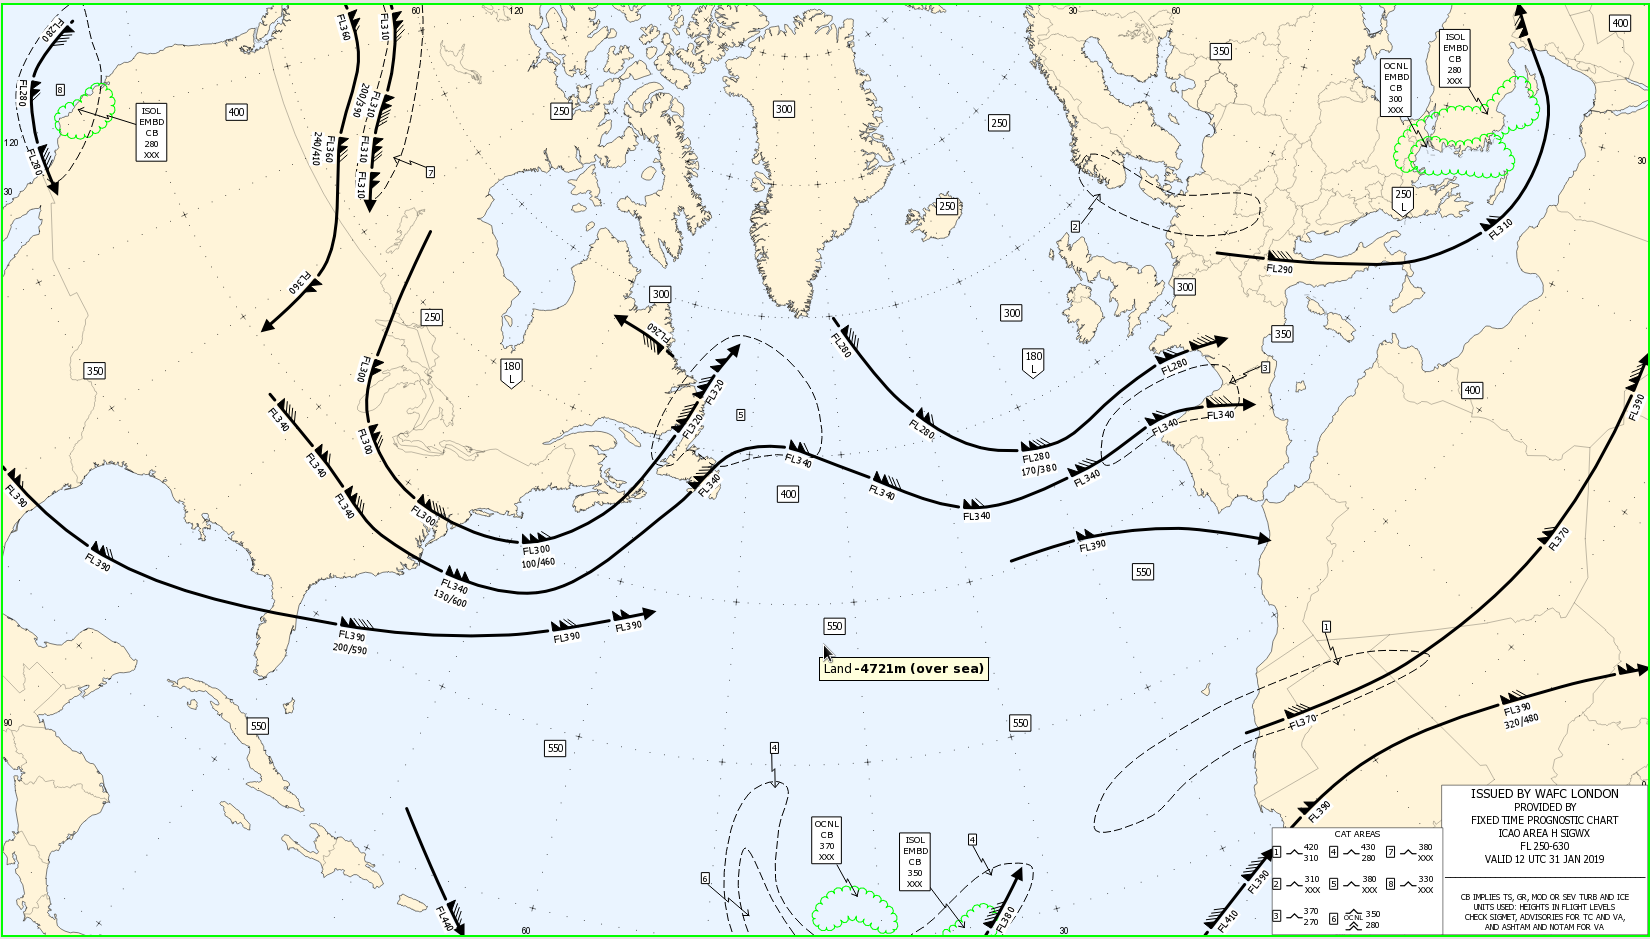
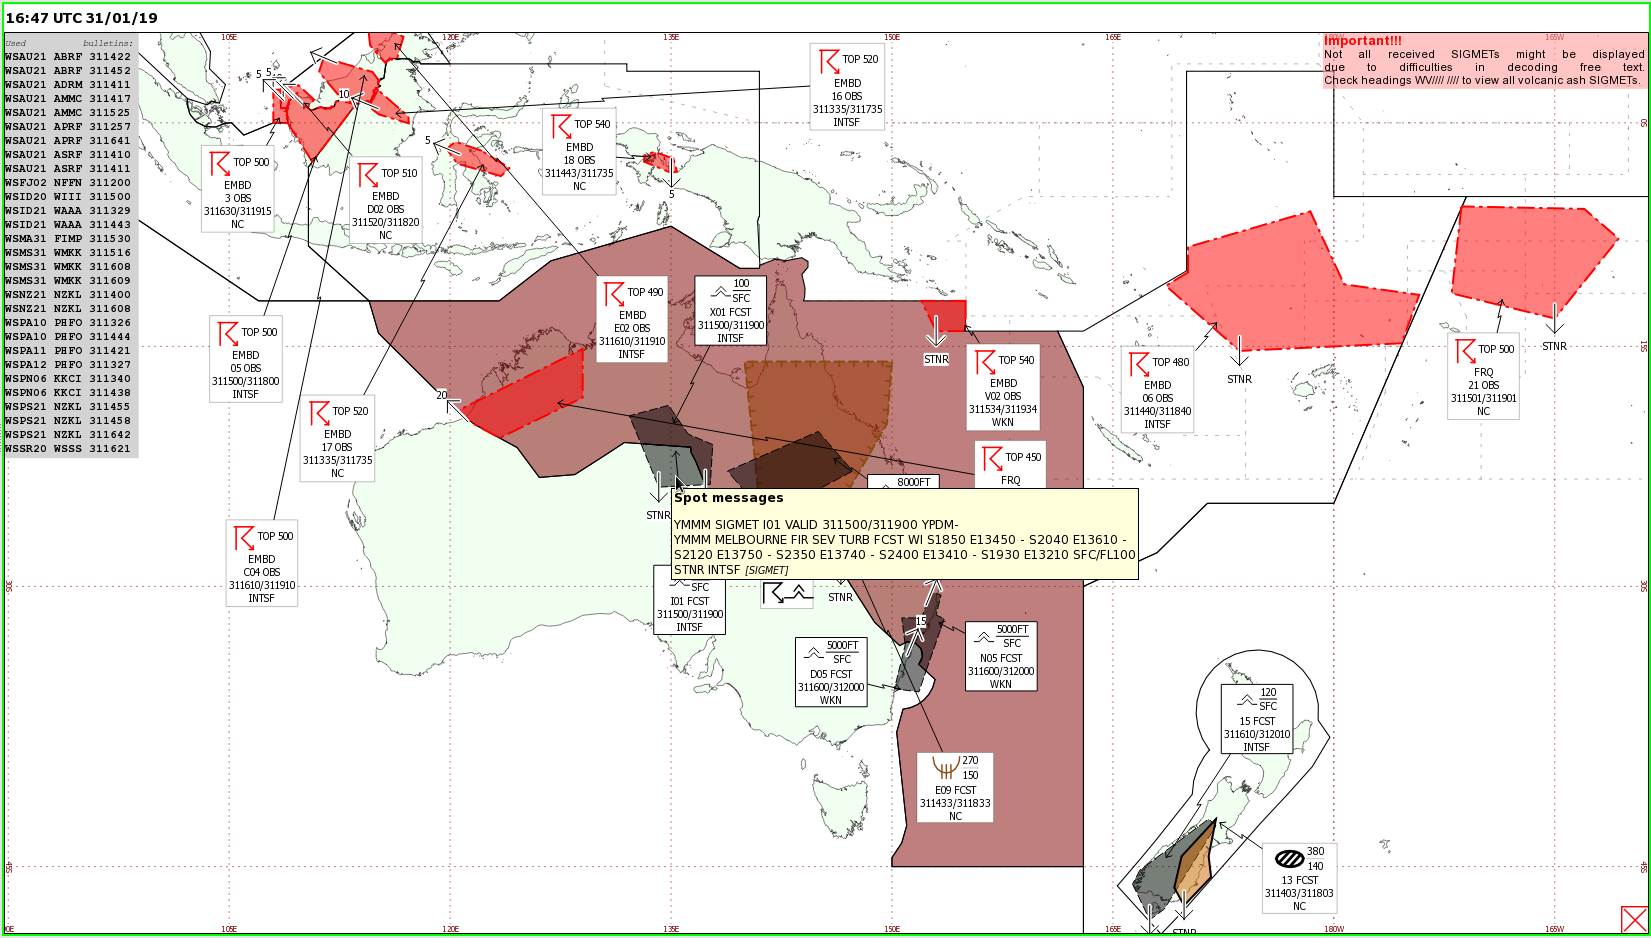
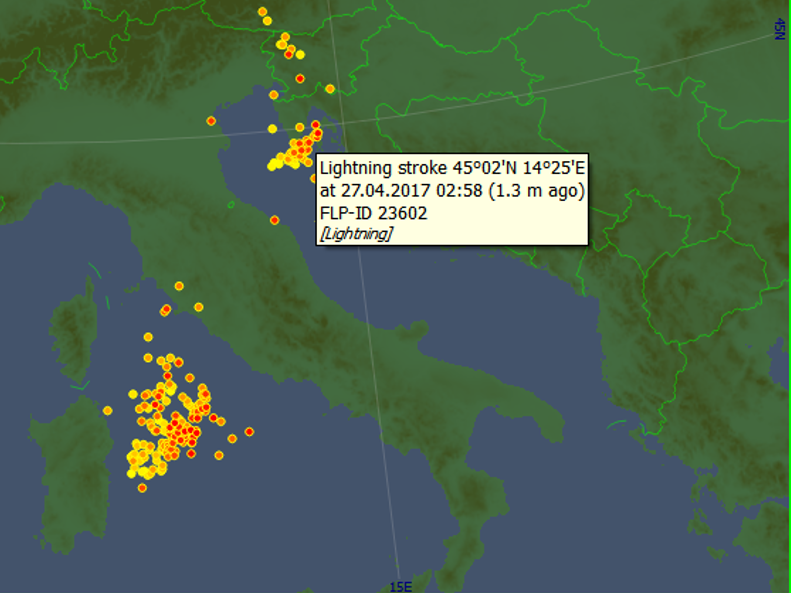
The system is designed to handle and visualise a multitude of data, for example

  • Lightning data from various lightning detection systems
  • Volcanic Ash from VA advisories and Tropical Cyclone Tracks from TC Advisories and TC Warnings
  • Tropical cyclone preformation tracks (plumes, strike probabilities) issued by ECWMF Ensemble model
  • Data from third party sources, including geographical systems, by using WMS as data source type
  • Web Camera streams
  • various custom data types

Animations

Any displayed data overlay can be animated.

  • Several animations can run simultaneously, either as independent animations or synchronised to the same validity
  •  Zooming and tooltip display are possible during the animation
  • The animation automatically updates with the arrival of new data
  • A set of animations can be saved, so users can access a set of latest loops with a single click

Multiviews

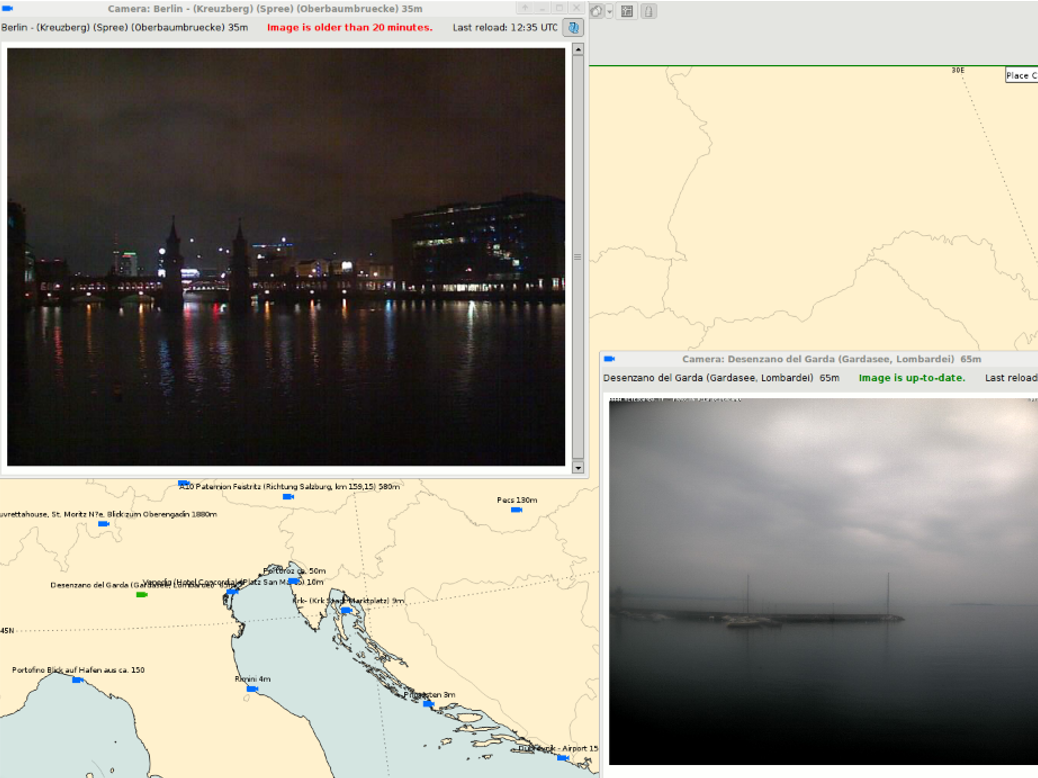
The multiview functionality allows you to split your data display to simultaneously view data from different times, levels, models, runs or charts.

  • Area selection can be synced, i.e. if you zoom in in one view, all other views will show the same area
  • The multiview syncs or compares various attributes of the map: for example the time multiview shows the same data from different times, the model multiview shows the same data from different models
  • The spot value info box  shows the values for the location from all views

Compare data from different times, models, etc

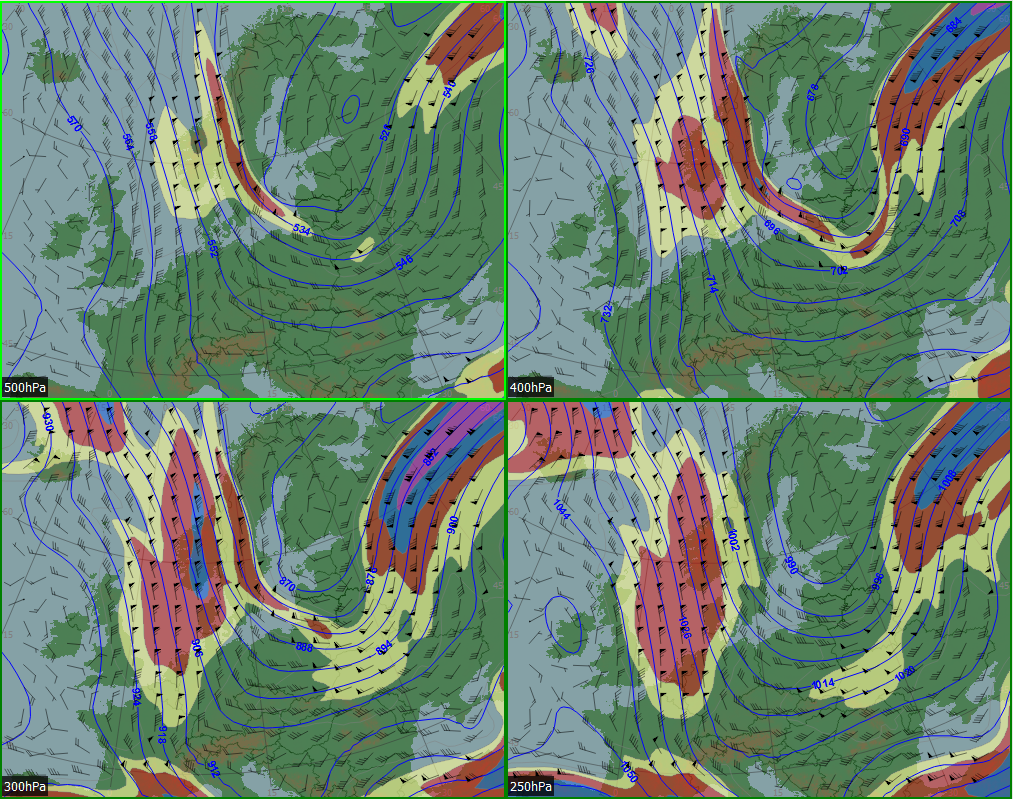
Follow the evolution of the phenomenon or verify the data from different models by showing the data in multiple windows.

Simultaneously view different data

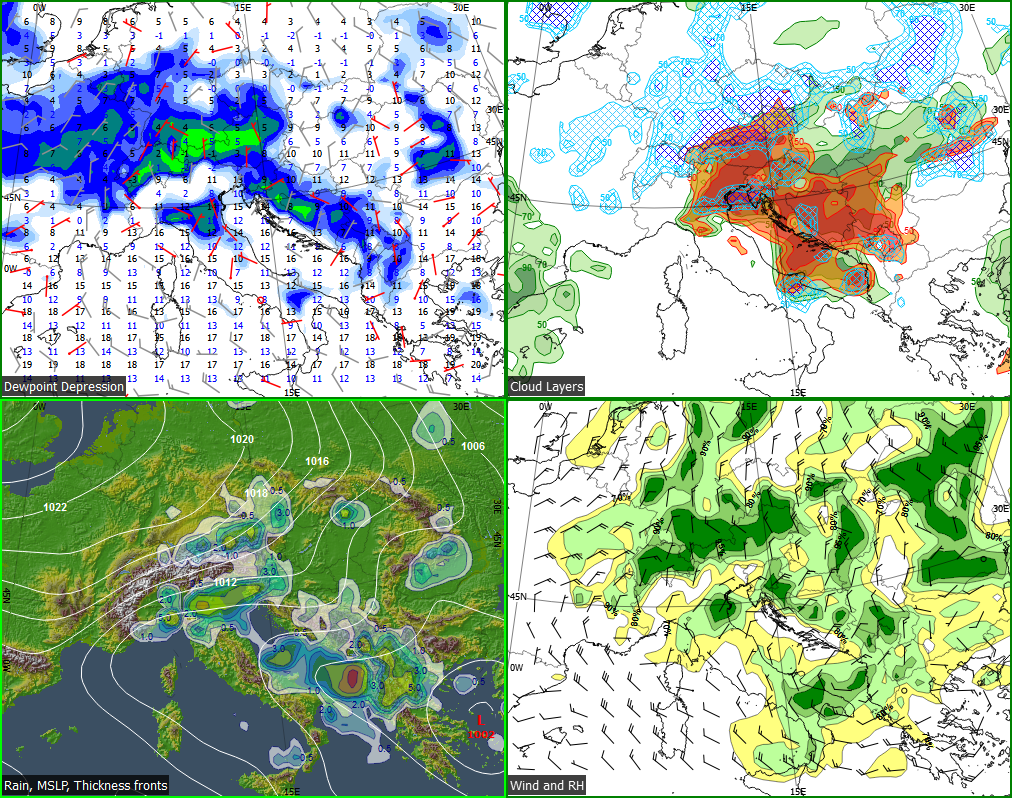
You can use the multiview to display various parameters side-by-side for a more effective evaluation of the weather situation.

© 2005 – 2024 IBL Software Engineering. All Rights Reserved.
Webdesign by Art4web. Development by YNK media.
cross