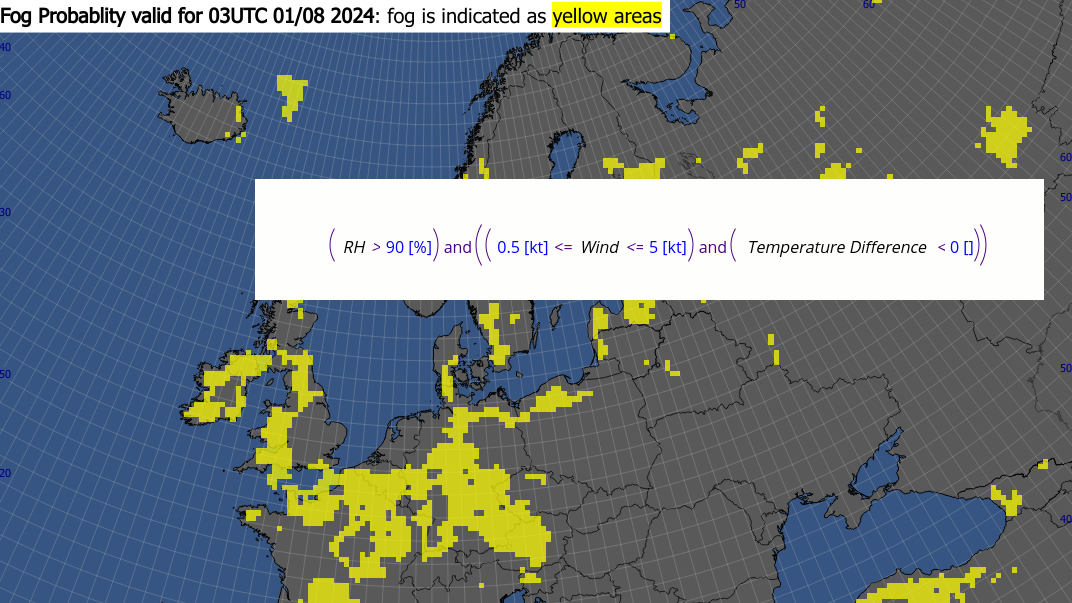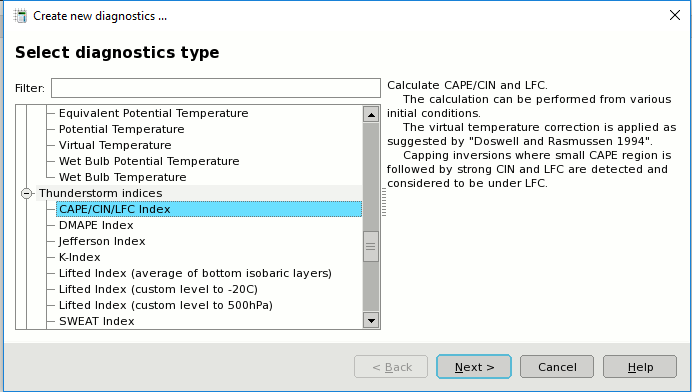
The Mathematical Kernel in Visual Weather powers decoding, data processing, and meteorological or scientific calculations, going beyond simple tasks like decoding any data, using algebraic or trigonometry expressions, grid field processing, thermodynamics, and more. With the Math Kernel, Visual Weather isn't just a basic data viewer; it transforms raw data into added-value products, such as:
Users can craft custom meteorological functions with ease through a graphical interface - no programming needed, just by picking desired function from the list of existing hundreds of functions. For advanced users, the Python API allows for deeper customisation using any input data type.

Visual Weather system of templates brings configurability of the system to a new level, in particular through the AnyT templates framework, offering an unparalleled ability to customize how your data is displayed on maps. Whether you're dealing with SYNOP, METAR, or other data sources such as lightning, cell tracking systems, warning products, or custom weather stations - AnyT templates enable you to define every aspect of your visualization, from selecting specific parameters to configuring graphical rendering elements, colours and tooltips.
Built on a robust XML-based framework, AnyT templates allow you to transform complex data sets into clear, insightful, and visually appealing map representations. You can craft tailored visualizations that meet your exact needs, ensuring that every map you create is both highly informative and visually compelling. With the power of AnyT templates, you can take full control of your data presentation, making your maps not only tools for analysis but also powerful means of communication.
Visual Weather allows users and developers to extend its functionalities by writing Python extension modules, with much of Visual Weather's API exposed for use by developers. Many features in Visual Weather have already been implemented in Python, and the potential for future customisation is vast. Through Python, users can access the core functions of the software, enabling the creation of Math Kernel extensions, custom data decoding plugins, custom visualisations, and more, effectively tailoring the platform to their specific needs.
The software includes an integrated Python engine with a comprehensive set of objects for database access, UI, rendering, and other components. This integration allows for the development of meteorological tools on top of Visual Weather's existing capabilities, enabling users to focus on business logic while leveraging the platform's robust toolkit. To fully utilise these capabilities, it is recommended to undertake Python API training, which provides essential experience in interfacing with IBL's functions.


If you need to do complex math calculations on top of existing grid fields such as NWP models or satellite imagery, the Field Diagnostics is here to help. It's designed to automatically compute a comprehensive range of derived parameters. These include:
The tool allows users to effortlessly select and compute specific parameters for designated model runs, with results saved as standard GRIB grid files, ensuring seamless integration into existing workflows. Computed fields are automatically ingested into the system's database and become available to users who can freely use them in the same way as any other source model field - no matter if it's for visualisations, triggering automated products or further custom computations.