A Leading Weather
Software Solution Provider
Software Solution Provider

Accurate weather analysis is crucial for studying atmospheric behaviour and understanding complex patterns. Utilizing tools like feature tracking, trajectory analysis, vertical profile studies, and On-Screen Analysis (OSA), allows meteorologists to explore the atmosphere's dynamics in greater depth. These tools help assess model uncertainties, refine forecasts, and provide a comprehensive view of weather systems, enabling more informed and reliable decision-making that impacts safety, planning, and daily activities
Observation data provides important context within the forecasting process. Make use of the various tools for exploring the observed data.
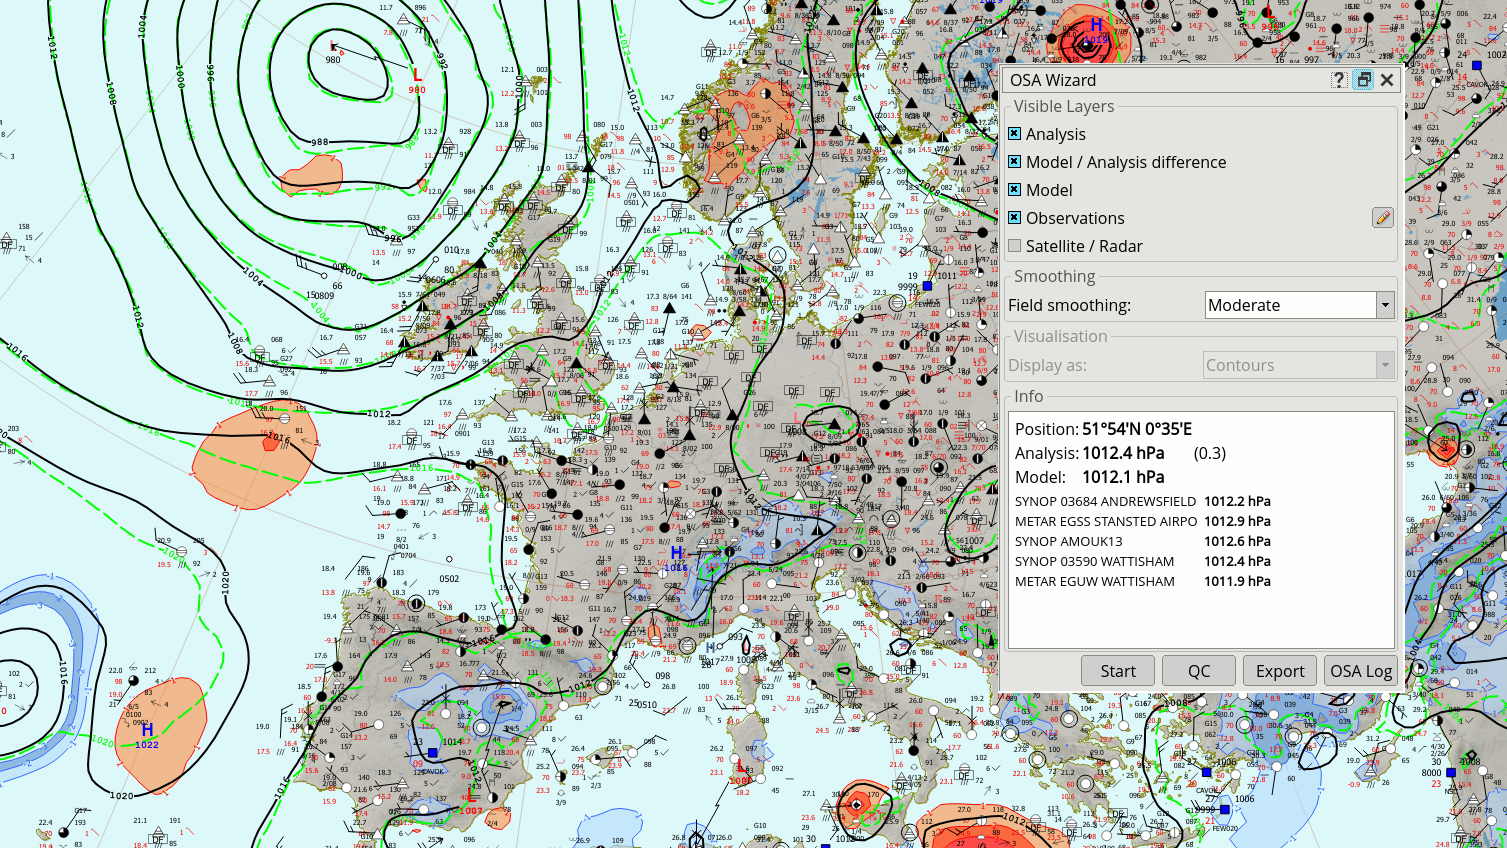
By allowing real-time integration of diverse data, On-Screen Analysis helps meteorologists identify discrepancies between observations and model outputs, enabling them to make more accurate and confident adjustments. This process reduces uncertainty and enhances the reliability of weather forecasts. At the beginning of the process, quality control is applied during analysis to eliminate erroneous observations. The visual highlighting areas where analysis values significantly differ from the model assists with model verification.
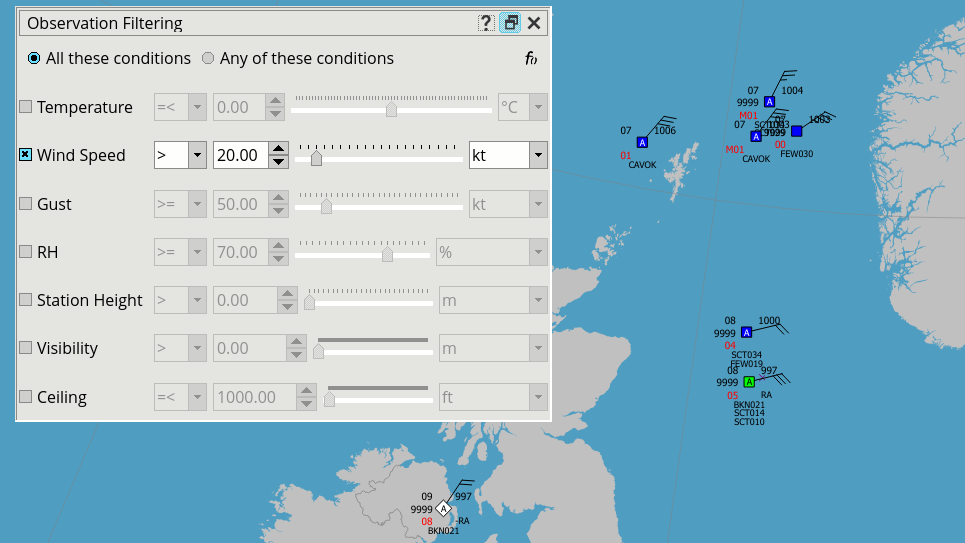
Filter observation based on user-specified thresholds, e.g. show only observations where wind speed is above 20 knots. The threshold value can be changed interactively and multiple thresholds can be applied.
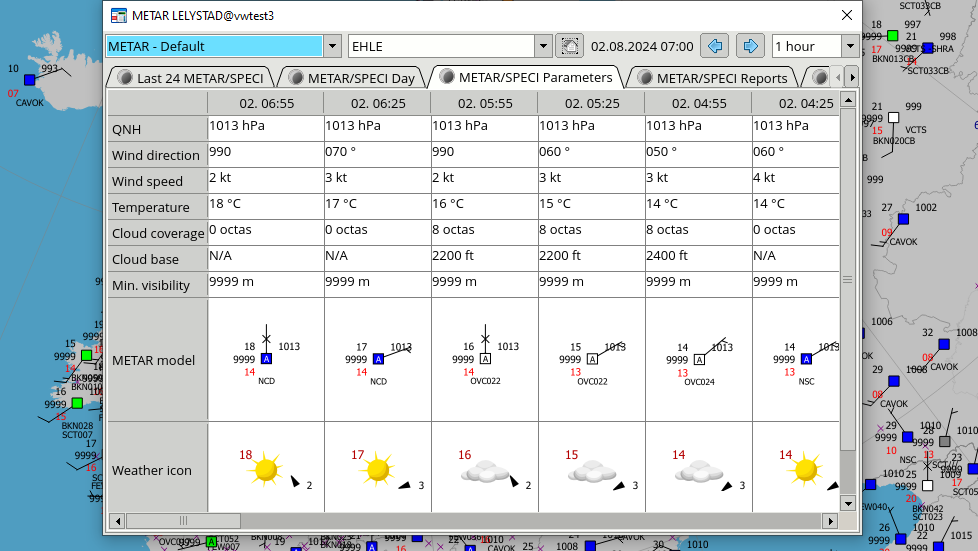
24-hour daily overview displayed for a station clicked on the map. The tabular overview shows: a tabular overview displays presented as plots, text reports or a parameter summary.
The Feature Tracking tool calculates the distance, direction and speed of movement between points at different times to track features, such as a low in a series of forecast MSLP fields, or a region of heavy rains on a series of radar images. Future positions can be extrapolated based on the prior speed, so you can, for example predict where a severe thunderstorm captured by radar will be in the next hour.
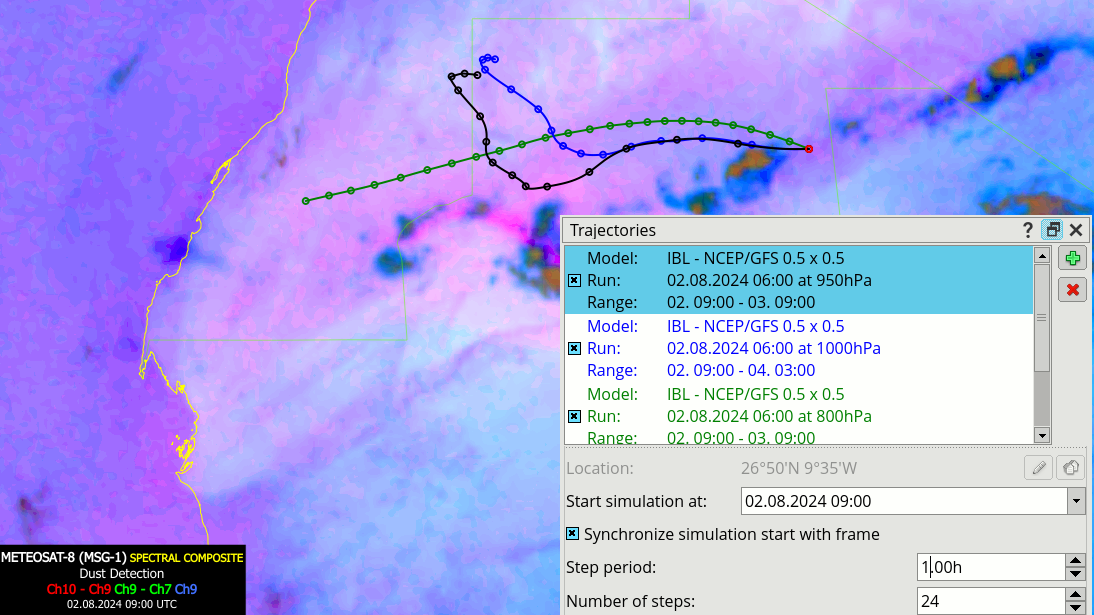
The Trajectory tool allows you to display the predicted motion of an air particle based on the forecast wind at a selected level. Multiple trajectories from different models or different levels can be displayed simultaneously. This tool can be used, for example, to estimate the movement of dust identified on a satellite image, propelled by wind at various levels.
Thermodiagrams offer an efficient way of analysing the atmosphere. Visual Weather offers an extensive array of upper air data tools.
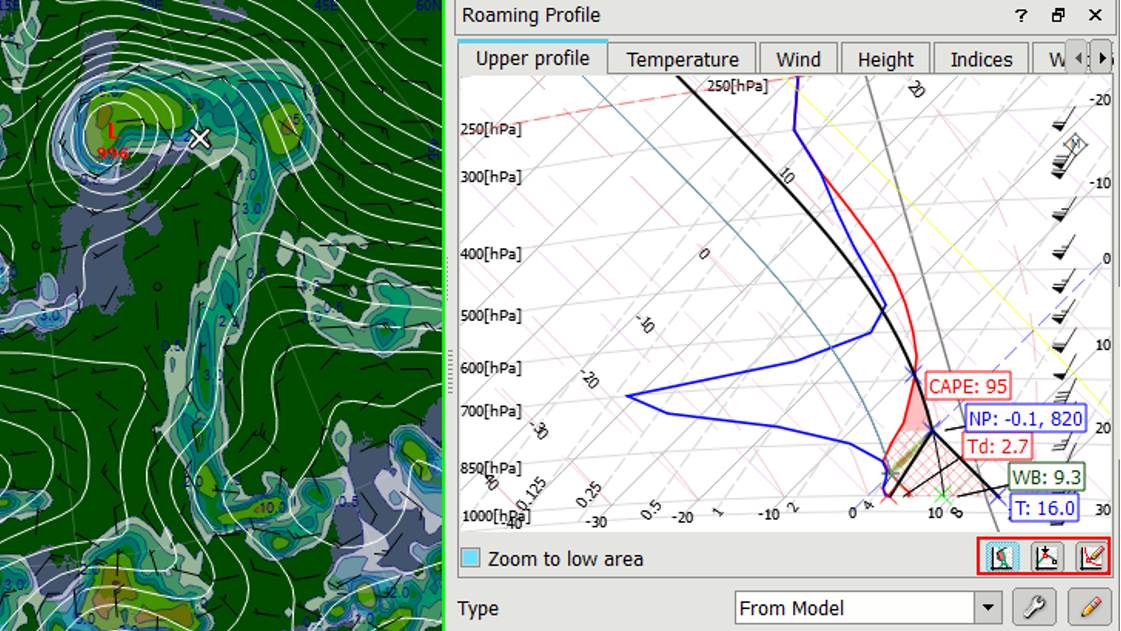
Roaming Profile displays a thermodiagram for any point clicked on the map. The data displayed on the side map helps to pinpoint areas of increased risk and the interactive profile provides extended information for precise identification of instability.
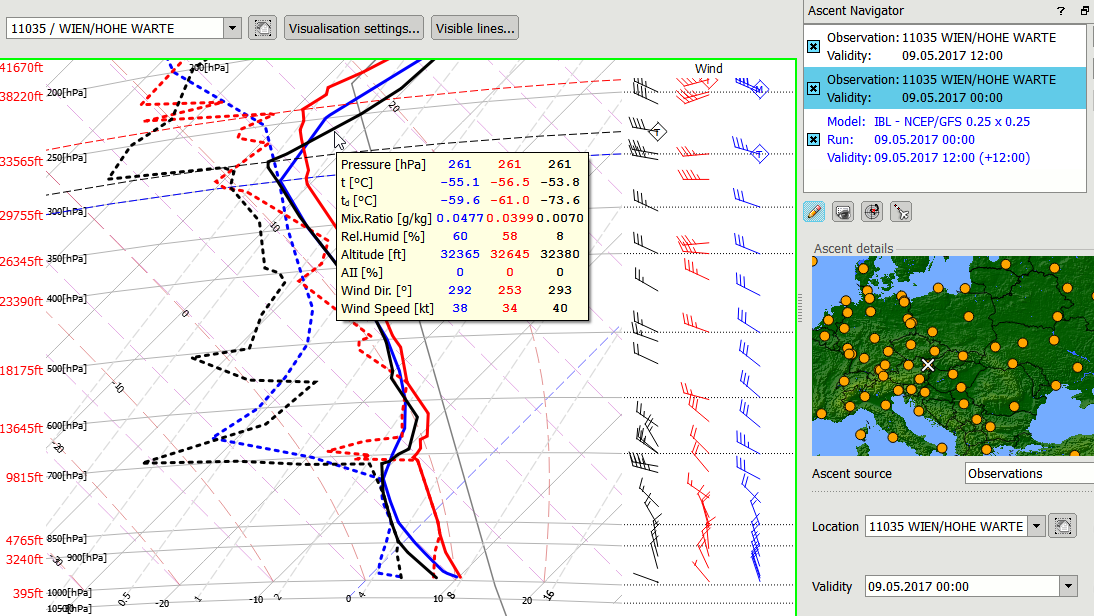
Easy overlay of data from various data sources allows to compare data from different models, models and observations or to overlay thermodiagrams from different forecast times.
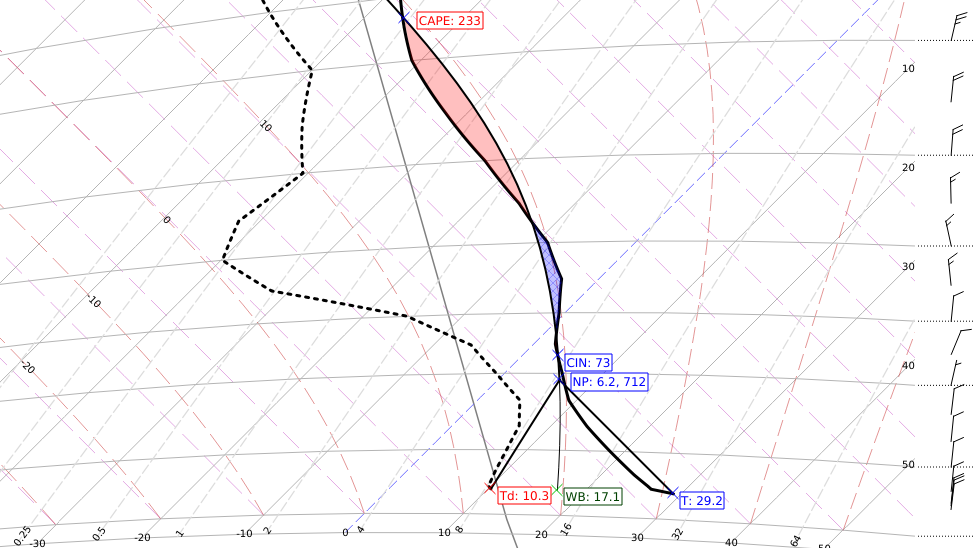
Move the surface temp or dewpoint to construct a Normand Point or CAPE or modify any value to study the effect of these changes in the diagnostics tables.
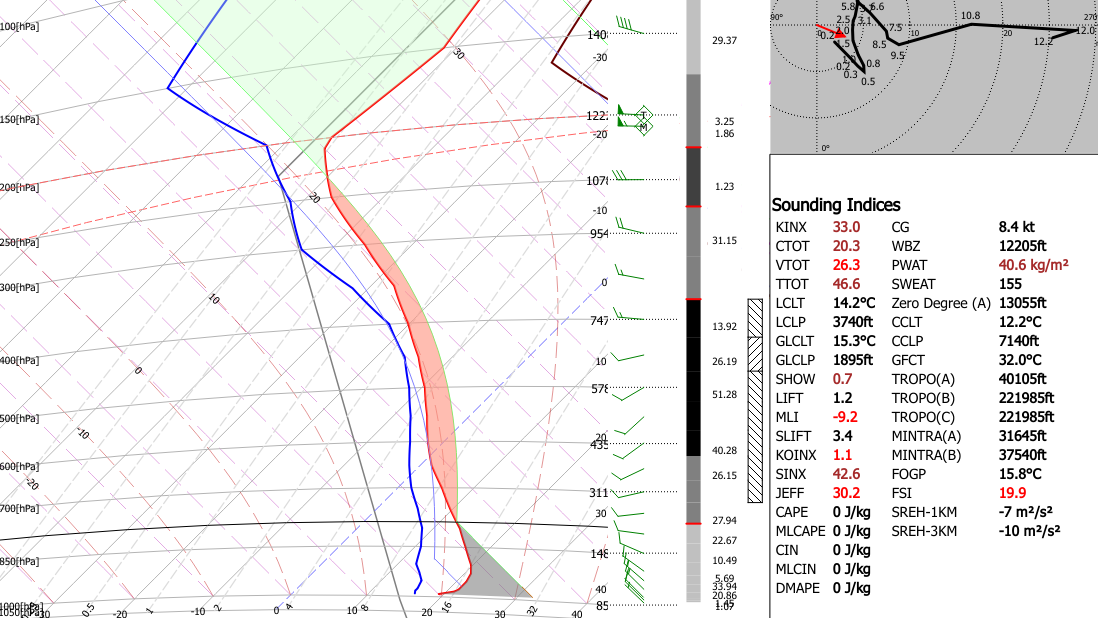
The profile display can be adjusted to show various elements such as MINTRA levels, potential temperature, etc. Tabulated overview of data and computed stability indexes show important details.
Go beyond the two-dimensional map display and view route-cross-sections or meteograms based on the NWP model, observation, satellite or radar data.
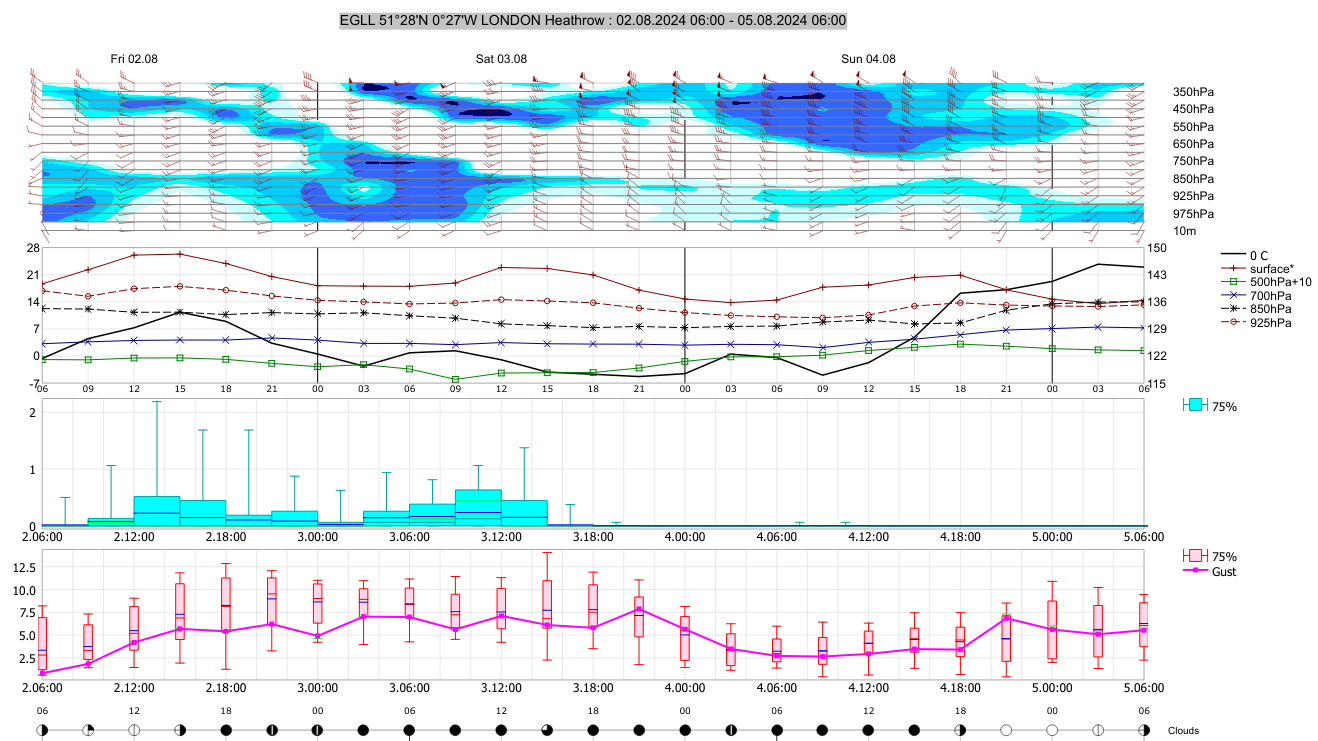
Access detailed data for selected locations and time ranges and visualise them as lines, bars, wind barbs, whisker plots, cloud coverage symbols, etc. This flexibility allows for a clear and comprehensive analysis of weather conditions.
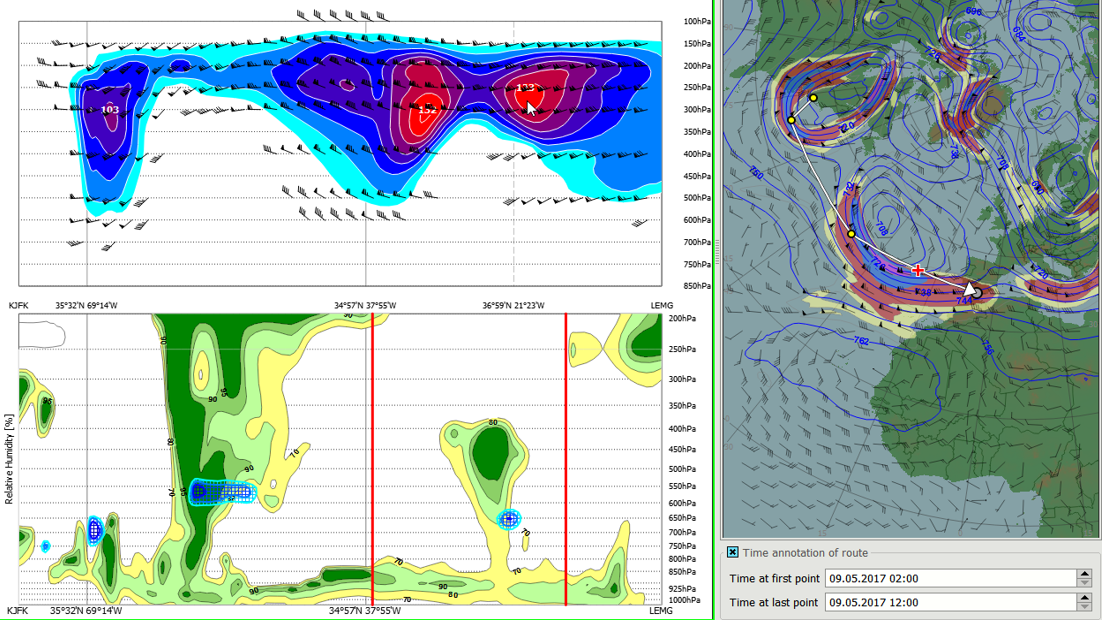
Easily adjust the route by clicking directly on the map. The cross-section view highlights the corresponding point on the map, making it simple to identify and avoid potentially dangerous sections of the route.